Vodafone 2009 Annual Report Download - page 107
Download and view the complete annual report
Please find page 107 of the 2009 Vodafone annual report below. You can navigate through the pages in the report by either clicking on the pages listed below, or by using the keyword search tool below to find specific information within the annual report.-
 1
1 -
2
-
3
-
4
-
5
-
6
-
7
-
8
-
9
-
10
-
11
-
12
-
13
-
14
-
15
-
16
-
17
-
18
-
19
-
20
-
21
-
22
-
23
-
24
-
25
-
26
-
27
-
28
-
29
-
30
-
31
-
32
-
33
-
34
-
35
-
36
-
37
-
38
-
39
-
40
-
41
-
42
-
43
-
44
-
45
-
46
-
47
-
48
-
49
-
50
-
51
-
52
-
53
-
54
-
55
-
56
-
57
-
58
-
59
-
60
-
61
-
62
-
63
-
64
-
65
-
66
-
67
-
68
-
69
-
70
-
71
-
72
-
73
-
74
-
75
-
76
-
77
-
78
-
79
-
80
-
81
-
82
-
83
-
84
-
85
-
86
-
87
-
88
-
89
-
90
-
91
-
92
-
93
-
94
-
95
-
96
-
 97
97 -
 98
98 -
 99
99 -
 100
100 -
 101
101 -
 102
102 -
 103
103 -
 104
104 -
 105
105 -
 106
106 -
 107
107 -
 108
108 -
 109
109 -
 110
110 -
 111
111 -
 112
112 -
 113
113 -
 114
114 -
 115
115 -
 116
116 -
 117
117 -
118
-
119
-
120
-
121
-
122
-
123
-
124
-
125
-
126
-
127
-
128
-
129
-
130
-
131
-
132
-
133
-
134
-
135
-
136
-
137
-
138
-
139
-
140
-
141
-
142
-
143
-
144
-
145
-
146
-
147
-
148
 |
 |

Financials
Vodafone Group Plc Annual Report 2009 105
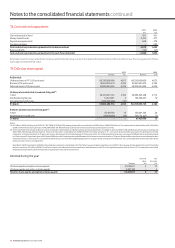
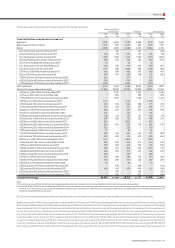
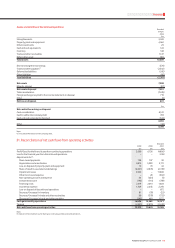
The fair value and carrying value of the Group’s long term borrowings is as follows:
Sterling equivalent
nominal value Fair value Carrying value
2009 2008 2009 2008 2009 2008
£m £m £m £m £m £m
Financial liabilities measured at amortised cost:
Bank loans 4,993 2,640 5,159 2,669 5,159 2,669
Redeemable preference shares 1,237 906 1,453 985 1,453 985
Bonds: 6,976 4,368 6,559 4,256 8,064 4,439
Euro floating rate note due February 2010 − 239 − 237 − 240
US dollar floating rate note due June 2011 245 176 227 227 245 176
Euro floating rate note due January 2012 1,203 1,035 1,136 1,007 1,218 1,046
US dollar floating rate note due February 2012 350 252 322 236 350 253
Czech Krona floating rate note due June 2013 18 − 18 − 18 −
Euro floating rate note due September 2013 786 676 714 644 788 679
Euro floating rate note due June 2014 1,157 995 1,029 930 1,158 998
5.125% euro 500 million bond due April 2015 463 398 470 397 495 427
5% euro 750 million bond due June 2018 694 597 699 578 721 620
7.875% US dollar 750 million bond due February 2030(1) 525 − 577 − 876 −
6.25% US dollar 495 million bond due November 2032(1) 346 − 333 − 485 −
6.15% US dollar 1,700 million bond due February 2037(1) 1,189 − 1,034 − 1,710 −
Other liabilities(2) 4,314 3,262 4,186 3,044 4,122 3,005
Bonds in fair value hedge relationships: 11,823 10,863 11,982 10,823 12,951 11,564
4.25% euro 1,900 million bond due May 2009 − 1,512 − 1,509 − 1,543
4.75% euro 859 million bond due May 2009 − 683 − 695 − 709
7.75% US dollar 2,725 million bond due February 2010 − 1,372 − 1,466 − 1,492
5.875% euro 1,250 million bond due June 2010 1,157 − 1,195 − 1,258 −
5.5% US dollar 750 million bond due June 2011 525 378 544 386 575 410
5.35% US dollar 500 million bond due February 2012 350 252 357 255 385 271
3.625% euro 750 million bond due November 2012 694 597 689 564 726 584
3.625% euro 250 million bond due November 2012 231 − 230 − 241 −
6.75% Australian dollar 265 million bond due January 2013 128 122 127 121 140 119
5.0% US dollar 1,000 million bond due December 2013 699 503 713 532 786 541
6.875% euro 1,000 million bond due December 2013 925 − 1,005 − 973 −
4.625% sterling 350 million bond due September 2014 350 350 352 319 381 347
4.625% sterling 525 million bond due September 2014 525 − 526 − 519 −
2.15% Japanese yen 3,000 billion bond due April 2015 21 − 22 − 22 −
5.375% US dollar 900 million bond due January 2015 630 453 632 461 711 483
5.0% US dollar 750 million bond due September 2015 525 378 516 419 598 406
6.25% euro 1,250 million bond due January 2016 1,157 − 1,208 − 1,182 −
5.75% US dollar 750 million bond due March 2016 525 378 527 375 614 415
4.75% euro 500 million bond due June 2016 463 398 448 378 512 409
5.625% US dollar 1,300 million bond due February 2017 909 654 904 640 1,070 716
4.625% US dollar 500 million bond due July 2018 350 252 315 227 392 257
8.125% sterling 450 million bond due November 2018 450 − 535 − 483 −
5.375% euro 500 million bond June 2022 463 398 433 374 534 420
5.625% sterling 250 million bond due December 2025 250 250 234 220 287 259
6.6324% euro 50 million bond due December 2028 46 − 46 − 50 −
7.875% US dollar 750 million bond due February 2030(1) − 378 − 409 − 514
5.9% sterling 450 million bond due November 2032 450 450 424 410 512 458
6.25% US dollar 495 million bond due November 2032(1) − 249 − 258 − 275
6.15% US dollar 1,700 million bond due February 2037(1) − 856 − 805 − 936
Long term borrowings 29,343 22,039 29,339 21,777 31,749 22,662
Notes:
(1) During the year ended 31 March 2009, fair value hedge relationships relating to bonds with nominal value US$2,945 million (£2,060 million) were de-designated.
(2) Amount at 31 March 2009 includes £3,606 million ( 2008: £2,476 million ) in relation to the written put options disclosed in note 12 and written put options gr anted to the Essar Group that , if exercised,
would allow the Essar Group to sell its 33% shareholding in Vodafone Essar to the Group for US$5 billion or to sell between US$1 billion and US$5 billion worth of Vodafone Essar shares at an
independently appraised fair market value.
Fair values are calculated using discounted cash flows with a discount rate based upon forward interest rates available to the Group at the balance sheet date.
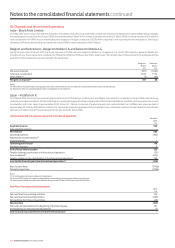
Banks loans include a ZAR6.1 billion loan held by Vodafone Holdings SA Pty Limited (‘VHSA’), which directly and indirectly owns the Group’s 50% interest in Vodacom Group
(Pty) Limited. VHSA has pledged its 100% equity shareholding in Vodafone Investments SA (‘VISA’) as security for its loan obligations. The terms and conditions of the pledge
mean that should VHSA not meet all of its loan payment and performance obligations, the lenders may sell the equity shareholding in its subsidiary VISA at market value to
recover their losses, with any remaining sales proceeds being returned to VHSA. Vodafone International Holdings B.V. and VISA have also guaranteed this loan with recourse
only to the VHSA and Vodafone Telecommunications Investment SA (‘VTISA’) shares they have respectively pledged. The terms and conditions of the security arrangement
mean the lenders may be able to sell these respective shares in preference to the VISA shares held by VHSA. An arrangement has been put in place where the Vodacom
Group (Pty) Limited shares held by VHSA and VTISA are held in an escrow account to ensure the shares cannot be sold to satisfy the pledge made by both companies. The
maximum collateral provided is ZAR6.4 billion, being the carrying value of the bank loan at 31 March 2009 (2008: ZAR7.5 billion). Bank loans also include INR130 billion of
loans held by Vodafone Essar Limited (‘VEL’) and its subsidiaries (the ‘VEL Group’). The VEL Group has a number of security arrangements supporting its secured loan