Vodafone 2009 Annual Report Download - page 33
Download and view the complete annual report
Please find page 33 of the 2009 Vodafone annual report below. You can navigate through the pages in the report by either clicking on the pages listed below, or by using the keyword search tool below to find specific information within the annual report.-
 1
1 -
2
-
3
-
4
-
5
-
6
-
7
-
8
-
9
-
10
-
11
-
12
-
13
-
14
-
15
-
16
-
17
-
18
-
19
-
20
-
21
-
22
-
 23
23 -
 24
24 -
 25
25 -
 26
26 -
 27
27 -
 28
28 -
 29
29 -
 30
30 -
 31
31 -
 32
32 -
 33
33 -
 34
34 -
 35
35 -
 36
36 -
 37
37 -
 38
38 -
 39
39 -
 40
40 -
 41
41 -
 42
42 -
 43
43 -
44
-
45
-
46
-
47
-
48
-
49
-
50
-
51
-
52
-
53
-
54
-
55
-
56
-
57
-
58
-
59
-
60
-
61
-
62
-
63
-
64
-
65
-
66
-
67
-
68
-
69
-
70
-
71
-
72
-
73
-
74
-
75
-
76
-
77
-
78
-
79
-
80
-
81
-
82
-
83
-
84
-
85
-
86
-
87
-
88
-
89
-
90
-
91
-
92
-
93
-
94
-
95
-
96
-
97
-
98
-
99
-
100
-
101
-
102
-
103
-
104
-
105
-
106
-
107
-
108
-
109
-
110
-
111
-
112
-
113
-
114
-
115
-
116
-
117
-
118
-
119
-
120
-
121
-
122
-
123
-
124
-
125
-
126
-
127
-
128
-
129
-
130
-
131
-
132
-
133
-
134
-
135
-
136
-
137
-
138
-
139
-
140
-
141
-
142
-
143
-
144
-
145
-
146
-
147
-
148
 |
 |

Performance
Vodafone Group Plc Annual Report 2009 31
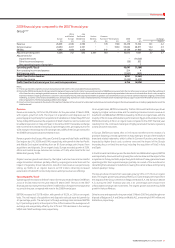
Revenue
Revenue increased by 14.1% to £35,478 million for the year ended 31 March 2008,
with organic growth of 4.2%. The impact of acquisitions and disposals was 6.5
percentage points, primarily from acquisitions of subsidiaries in India in May 2007 and
Turkey in May 2006 as well as the acquisition of Tele2’s fixed line communication and
broadband operations in Italy and Spain in December 2007. Favourable exchange
rate movements increased revenue by 3.4 percentage points, principally due to the
4.2% change in the average euro/£ exchange rate, as 60% of the Group’s revenue for
the 2008 financial year was denominated in euro.
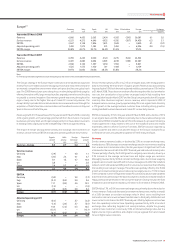
Revenue grew in the Europe, Africa and Central Europe and Asia Pacific and Middle
East regions by 6.1%, 20.8% and 87.4%, respectively, with growth in the Asia Pacific
and Middle East region benefiting from an 81.9 percentage point impact from
acquisitions and disposals. On an organic basis, Europe recorded growth of 2.0%,
Africa and Central Europe delivered an increase of 13.6%, while Asia Pacific and
Middle East grew by 15.9%.
Organic revenue growth was driven by the higher customer base and successful
usage stimulation initiatives, partially offset by ongoing price reductions and the
impact of regulatory driven reductions. Growth in data revenue was particularly
strong, up 39.0% on an organic basis to £2,119 million, reflecting increased
penetration of mobile PC connectivity devices and improved service offerings.
Operating profit/(loss)
Operating profit increased to £10,047 million for the year ended 31 March 2008 from
a loss of £1,564 million for the year ended 31 March 2007. The loss in the 2007
financial year was mainly the result of the £11,600 million of impairment charges that
occurred in the year, compared with none in the 2008 financial year.
EBITDA increased to £13,178 million, with growth of 10.2%, or 2.6% on an organic
basis. The net impact of acquisitions and disposals reduced reported growth by
4.5 percentage points. The net impact of foreign exchange rates increased EBITDA
by 3.1 percentage points, as the impact of the 4.2% increase in the average euro/£
exchange rate was partially offset by the 5.7% and 7.2% decreases in the average
US$/£ and ZAR/£ exchange rates, respectively.
On an organic basis, EBITDA increased by 15.6% in Africa and Central Europe, driven
largely by a higher customer base and the resulting increase in service revenue. In
Asia Pacific and Middle East, EBITDA increased by 14.3% on an organic basis, with the
majority of the increase attributable to performances in Egypt and Australia. Europe’s
EBITDA declined by 0.1% on an organic basis compared to the 2007 financial year,
resulting from the continued challenges of highly penetrated markets, regulatory
activity and price reductions.
In Europe, EBITDA was stated after a £115 million benefit from the release of a
provision following a revised agreement in Italy relating to the use of the Vodafone
brand and related trademarks, which is offset in Common Functions, and was also
impacted by higher direct costs, customer costs and the impact of the Group’s
increasing focus on fixed line services, including the acquisition of Tele2 in Italy
and Spain.
In the Africa and Central Europe and the Asia Pacific and Middle East regions, EBITDA
was impacted by the investment in growing the customer base and the impact of the
acquisitions in Turkey and India, respectively. Both India and Turkey generated lower
operating profits than regional averages, partially as a result of the investment in
rebranding the businesses to Vodafone, increasing the customer base and improving
network quality in Turkey.
The Group’s share of results from associates grew by 5.5%, or 15.1% on an organic
basis. The organic growth was partially offset by a 5.5 percentage point impact from
the disposal of the Group’s interests in Belgacom Mobile S.A. and Swisscom Mobile
A.G. during the 2007 financial year and a 4.1 percentage point impact from
unfavourable exchange rate movements. The organic growth was driven by 24.8%
growth in Verizon Wireless.
Other income and expense for the year ended 31 March 2007 included the gains on
disposal of Belgacom S.A. and Swisscom Mobile A.G., amounting to £441 million and
£68 million, respectively.
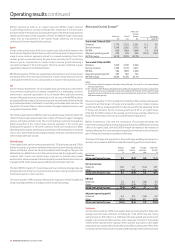
2008 nancial year compared to the 2007 nancial year
Group(1)(2)
Africa Asia
and Central Pacific and Verizon Common
Europe Europe Middle East Wireless Functions(3) Eliminations 2008 2007 % change
£m £m £m £m £m £m £m £m £ Organic
Revenue 26,081 4,946 4,399 − 170 (118) 35,478 31,104 14.1 4.2
Service revenue 24,430 4,617 4,101 − − (106) 33,042 28,871 14.4 4.3
EBITDA 9,690 1,669 1,476 − 343 − 13,178 11,960 10.2 2.6
Adjusted operating profit 6,206 752 530 2,447 140 − 10,075 9,531 5.7 5.7
Adjustments for:
Impairment losses − (11,600)
Other income and expense (28) 502
Non-operating income of associates − 3
Operating profit/(loss) 10,047 (1,564)
Non-operating income and expense 254 4
Net financing costs (1,300) (823)
Profit/(loss) before taxation 9,001 (2,383)
Income tax expense (2,245) (2,423)
Profit/(loss) for the financial year from continuing operations 6,756 (4,806)
Notes:
(1) The Group revised its segment structure during the year. See note 3 to the consolidated financial statements.
(2) During the 2009 financial year, the Group revised its analysis of revenue and costs. Visitor revenue and revenue from MVNOs are now reported in the line ‘other service revenue’, rather than within each
of the lines for voice, messaging and data revenue. In the revised presentation of costs: direct costs include amounts previously reported as interconnect costs and other direct costs, except for
expenses related to ongoing commission; customer costs include amounts previously reported within acquisition costs and retention costs, as well as expenses related to ongoing commissions,
marketing, customer care and sales and distribution; and operating expenses are now comprised primarily of network and IT related expenditure, support costs from HR and finance and certain
intercompany items. The following analysis reflects this change.
(3) Common Functions represents the results of the partner markets and the net result of unallocated central Group costs and recharges to the Group’s operations, including royalty fees for use of the
Vodafone brand.