Vodafone 2009 Annual Report Download - page 102
Download and view the complete annual report
Please find page 102 of the 2009 Vodafone annual report below. You can navigate through the pages in the report by either clicking on the pages listed below, or by using the keyword search tool below to find specific information within the annual report.-
 1
1 -
2
-
3
-
4
-
5
-
6
-
7
-
8
-
9
-
10
-
11
-
12
-
13
-
14
-
15
-
16
-
17
-
18
-
19
-
20
-
21
-
22
-
23
-
24
-
25
-
26
-
27
-
28
-
29
-
30
-
31
-
32
-
33
-
34
-
35
-
36
-
37
-
38
-
39
-
40
-
41
-
42
-
43
-
44
-
45
-
46
-
47
-
48
-
49
-
50
-
51
-
52
-
53
-
54
-
55
-
56
-
57
-
58
-
59
-
60
-
61
-
62
-
63
-
64
-
65
-
66
-
67
-
68
-
69
-
70
-
71
-
72
-
73
-
74
-
75
-
76
-
77
-
78
-
79
-
80
-
81
-
82
-
83
-
84
-
85
-
86
-
87
-
88
-
89
-
90
-
91
-
 92
92 -
 93
93 -
 94
94 -
 95
95 -
 96
96 -
 97
97 -
 98
98 -
 99
99 -
 100
100 -
 101
101 -
 102
102 -
 103
103 -
 104
104 -
 105
105 -
 106
106 -
 107
107 -
 108
108 -
 109
109 -
 110
110 -
 111
111 -
 112
112 -
113
-
114
-
115
-
116
-
117
-
118
-
119
-
120
-
121
-
122
-
123
-
124
-
125
-
126
-
127
-
128
-
129
-
130
-
131
-
132
-
133
-
134
-
135
-
136
-
137
-
138
-
139
-
140
-
141
-
142
-
143
-
144
-
145
-
146
-
147
-
148
 |
 |
100 Vodafone Group Plc Annual Report 2009
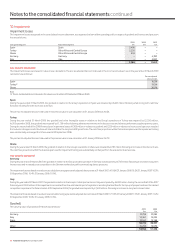
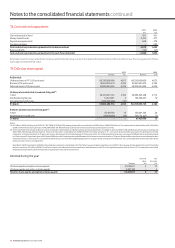
20. Share-based payments continued
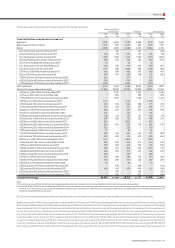
Summary of options outstanding and exercisable at 31 March 2009
Outstanding Exercisable
Weighted Weighted
average average
Weighted remaining Weighted remaining
Outstanding average contractual Exercisable average contractual
shares exercise life shares exercise life
Millions price Months Millions price Months
Vodafone Group savings related and sharesave plan:
£0.01 – £1.00 9 £0.92 17 – – –
£1.01 – £2.00 13 £1.24 37 – – –
22 £1.11 29 – – –
Vodafone Group executive plans:
£1.01 – £2.00 9 £1.58 28 9 £1.58 28
£2.01 – £3.00 20 £2.76 13 20 £2.76 13
29 £2.39 18 29 £2.39 18
Vodafone Group 1999 long term stock incentive plan:
£0.01 – £1.00 62 £0.90 39 62 £0.90 39
£1.01 – £2.00 219 £1.46 58 148 £1.48 41
281 £1.34 54 210 £1.31 40
Other share option plans:
£1.01 – £2.00 1 £1.14 35 1 £1.14 35
Greater than £3.01 1 £2.47 31 1 £2.47 31
2 £1.77 33 2 £1.77 33
Vodafone Group 1999 long term stock incentive plan:
$10.01 – $30.00 1 $15.37 43 1 $15.05 42
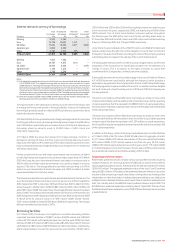
Fair value of options granted
ADS options Ordinary share options
Board of directors and
Other(1) Executive Committee(1) Other
2008 2007 2008 2007 2009 2008 2007
Expected life of option (years) 4-5 5-6 4-5 5-6 3-5 4-5 5-7
Expected share price volatility 25.5-33.5% 27.3-28.3% 25.7-27.7% 24.0-27.7% 30.9-31.0% 25.5-33.5% 25.5-28.3%
Dividend yield 3.8-4.2% 5.1-5.5% 4.0-4.4% 4.8-5.5% 5.04% 3.8-4.2% 5.1-6.1%
Risk free rates 4.4-5.7% 4.8% 5.5% 4.7-4.9% 4.9% 4.4-5.7% 4.6-4.9%
Exercise price(2) £1.67-1.76 £1.15 £1.68 £1.15-1.36 £1.21 £1.67-1.76 £1.14-1.16
Notes:
(1) There were no options granted in the year ended 31 March 2009.
(2) In the years ended 31 March 2008 and 31 March 2007, there was more than one option grant.
The fair value of options granted is estimated at the date of grant using a lattice-based option valuation model, which incorporates ranges of assumptions for inputs as
disclosed above. Certain options granted to the Board of directors and Executive Committee have a market based performance condition attached and as a result the
assumptions are disclosed separately.
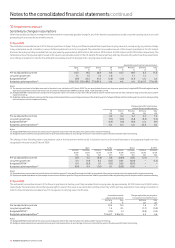
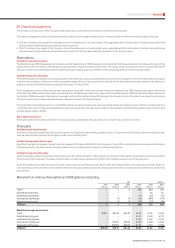
Share awards
Movements in non-vested shares during the year ended 31 March 2009 are as follows:
Global allshare plan Other Total
Weighted Weighted Weighted
average fair average fair average fair
value at value at value at
Millions grant date Millions grant date Millions grant date
1 April 2008 34 £1.30 213 £1.16 247 £1.18
Granted 17 £1.32 155 £1.05 172 £1.08
Vested (16) £1.04 (58) £1.15 (74) £1.13
Forfeited (3) £1.38 (22) £1.07 (25) £1.10
31 March 2009 32 £1.43 288 £1.11 320 £1.15
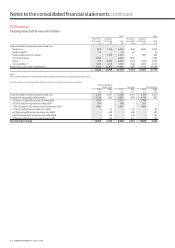
Other information
The weighted average grant date fair value of options granted during the 2009 financial year was £0.39 (2008: £0.34, 2007: £0.22).
The total fair value of shares vested during the year ended 31 March 2009 was £84 million (2008: £75 million, 2007: £41 million).
The compensation cost included in the consolidated income statement in respect of share options and share plans for continuing operations was £128 million (2008: £107 million,
2007: £93 million), which is comprised entirely of equity-settled transactions.
The average share price for the year ended 31 March 2009 was 136 pence.
Notes to the consolidated nancial statements continued