Vodafone 2009 Annual Report Download - page 62
Download and view the complete annual report
Please find page 62 of the 2009 Vodafone annual report below. You can navigate through the pages in the report by either clicking on the pages listed below, or by using the keyword search tool below to find specific information within the annual report.-
 1
1 -
2
-
3
-
4
-
5
-
6
-
7
-
8
-
9
-
10
-
11
-
12
-
13
-
14
-
15
-
16
-
17
-
18
-
19
-
20
-
21
-
22
-
23
-
24
-
25
-
26
-
27
-
28
-
29
-
30
-
31
-
32
-
33
-
34
-
35
-
36
-
37
-
38
-
39
-
40
-
41
-
42
-
43
-
44
-
45
-
46
-
47
-
48
-
49
-
50
-
51
-
 52
52 -
 53
53 -
 54
54 -
 55
55 -
 56
56 -
 57
57 -
 58
58 -
 59
59 -
 60
60 -
 61
61 -
 62
62 -
 63
63 -
 64
64 -
 65
65 -
 66
66 -
 67
67 -
 68
68 -
 69
69 -
 70
70 -
 71
71 -
 72
72 -
73
-
74
-
75
-
76
-
77
-
78
-
79
-
80
-
81
-
82
-
83
-
84
-
85
-
86
-
87
-
88
-
89
-
90
-
91
-
92
-
93
-
94
-
95
-
96
-
97
-
98
-
99
-
100
-
101
-
102
-
103
-
104
-
105
-
106
-
107
-
108
-
109
-
110
-
111
-
112
-
113
-
114
-
115
-
116
-
117
-
118
-
119
-
120
-
121
-
122
-
123
-
124
-
125
-
126
-
127
-
128
-
129
-
130
-
131
-
132
-
133
-
134
-
135
-
136
-
137
-
138
-
139
-
140
-
141
-
142
-
143
-
144
-
145
-
146
-
147
-
148
 |
 |

60 Vodafone Group Plc Annual Report 2009
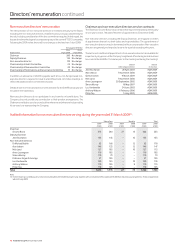
Details of the GLTI performance shares
The number of shares vesting depends on the performance of two measures: free cash flow and relative TSR. This section sets out how the performance of each of the two
measures is calculated.
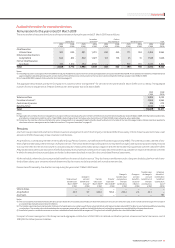
Underlying operational performance – adjusted free cash flow
The free cash flow performance is based on a three year cumulative adjusted free cash flow figure. The definition of adjusted free cash flow is reported free cash
flow excluding:
Verizon Wireless additional distributions;•
Spectrum (licence) costs;•
Foreign exchange movements over the performance period; and•
Material one-off tax settlements.•
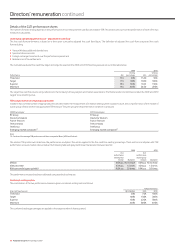
The cumulative adjusted free cash flow target and range for awards in the 2009 and 2010 financial years are set out in the table below:
2009 2010
Vesting Vesting
Performance £bn percentage £bn percentage
Threshold 15.5 50% 15.50 50%
Target 17.5 100% 18.00 100%
Superior 18.5 150% 19.25 150%
Maximum 19.5 200% 20.50 200%
The target free cash flow level is set by reference to the Company’s three year plan and market expectations. The Remuneration Committee consider the 2009 and 2010
targets to be stretching ones.
TSR out-performance of a peer group median
Vodafone has a limited number of appropriate peers and this makes the measurement of a relative ranking system volatile. As such, the out-performance of the median of
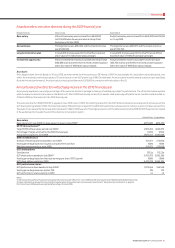
a peer group is felt to be the most appropriate TSR measure. The peer group for the performance condition is as follows:
2009 financial year 2010 financial year
BT Group BT Group
Deutsche Telekom Deutsche Telekom
France Telecom France Telecom
Telecom Italia Telecom Italia
Telefonica Telefonica
Emerging market composite(1) Emerging market composite(1)
Note:
(1) Consists of the average TSR performance of three companies: Bharti, MTN and Turkcell.
The relative TSR position will determine the performance multiplier. This will be applied to the free cash flow vesting percentage. There will be no multiplier until TSR
performance exceeds median. Above median the following table will apply (with linear interpolation between points):
2009 2010
Out- Out-
performance performance
of peer group of peer group
median Multiplier median Multiplier
Median 0.0% p.a. No increase 0.0% p.a. No increase
65th percentile 4.5% p.a. 1.5 times 4.5% p.a. 1.5 times
80th percentile (upper quintile) 9.0% p.a. 2.0 times 9.0% p.a. 2.0 times
The performance measure has been calibrated using statistical techniques.
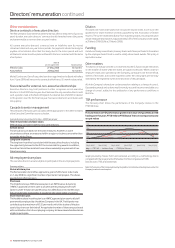
Combined vesting matrix
The combination of the two performance measures gives a combined vesting matrix as follows:
TSR performance
Free cash flow measure Up to Median 65th 80th
Threshold 50% 75% 100%
Target 100% 150% 200%
Superior 150% 225% 300%
Maximum 200% 300% 400%
The combined vesting percentages are applied to the target number of shares granted.
Directors’ remuneration continued