Vodafone 2009 Annual Report Download - page 38
Download and view the complete annual report
Please find page 38 of the 2009 Vodafone annual report below. You can navigate through the pages in the report by either clicking on the pages listed below, or by using the keyword search tool below to find specific information within the annual report.-
 1
1 -
2
-
3
-
4
-
5
-
6
-
7
-
8
-
9
-
10
-
11
-
12
-
13
-
14
-
15
-
16
-
17
-
18
-
19
-
20
-
21
-
22
-
23
-
24
-
25
-
26
-
27
-
 28
28 -
 29
29 -
 30
30 -
 31
31 -
 32
32 -
 33
33 -
 34
34 -
 35
35 -
 36
36 -
 37
37 -
 38
38 -
 39
39 -
 40
40 -
 41
41 -
 42
42 -
 43
43 -
 44
44 -
 45
45 -
 46
46 -
 47
47 -
 48
48 -
49
-
50
-
51
-
52
-
53
-
54
-
55
-
56
-
57
-
58
-
59
-
60
-
61
-
62
-
63
-
64
-
65
-
66
-
67
-
68
-
69
-
70
-
71
-
72
-
73
-
74
-
75
-
76
-
77
-
78
-
79
-
80
-
81
-
82
-
83
-
84
-
85
-
86
-
87
-
88
-
89
-
90
-
91
-
92
-
93
-
94
-
95
-
96
-
97
-
98
-
99
-
100
-
101
-
102
-
103
-
104
-
105
-
106
-
107
-
108
-
109
-
110
-
111
-
112
-
113
-
114
-
115
-
116
-
117
-
118
-
119
-
120
-
121
-
122
-
123
-
124
-
125
-
126
-
127
-
128
-
129
-
130
-
131
-
132
-
133
-
134
-
135
-
136
-
137
-
138
-
139
-
140
-
141
-
142
-
143
-
144
-
145
-
146
-
147
-
148
 |
 |

36 Vodafone Group Plc Annual Report 2009
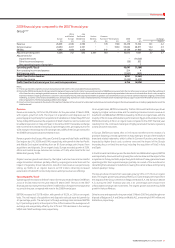
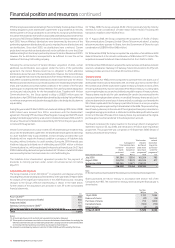
The impact of merger and acquisition activity and foreign exchange movements on
revenue, service revenue, EBITDA and adjusted operating profit are shown below:
Organic M&A Foreign Reported
growth activity exchange growth
% pps pps %
Revenue
Asia Pacific and Middle East 15.9 81.9 (10.4) 87.4
Service revenue
India – – – –
Other 16.2 – (7.2) 9.0
Asia Pacific and Middle East 16.2 86.6 (12.4) 90.4
EBITDA
India – – – –
Other 14.3 – (8.1) 6.2
Asia Pacific and Middle East 14.3 77.6 (13.2) 78.7
Adjusted operating profit
India – – – –
Other 8.1 – (3.4) 4.7
Asia Pacific and Middle East 8.1 7.6 (3.4) 12.3
India
At constant exchange rates, Vodafone Essar performed well since acquisition, with
growth in revenue of 55% assuming the Group owned the business for the whole
of both periods. Since acquisition, there were 16.4 million net customer additions,
bringing the total customer base to 44.1 million at 31 March 2008. Penetration
in mobile telephony increased following falling prices of both handsets and tariffs and
network coverage increases. The market remains competitive and prepaid offerings
are moving to lifetime validity products, which allow the customer to stay connected
to the network without requiring any top ups. Revenue continued to grow as the
customer base increased, particularly in outgoing voice as service offerings drove
greater usage.
The Indian mobile market continued to grow, with penetration reaching 23% by
the end of March 2008. Vodafone Essar, which successfully adopted the Vodafone
brand in September 2007, continued to perform well, with EBITDA slightly ahead
of expectations held at the time of the completion of the acquisition. This was partially
due to the Group’s rapid network expansion in this market together with
improvements in operating expense efficiency, particularly in customer care.
The outsourcing of the IT function was implemented during January 2008 and is
expected to lead to the faster roll out of more varied services to customers, while
delivering greater cost efficiencies.
Other Asia Pacific and Middle East
Service revenue increased by 9.0%, by 16.2% on an organic basis, driven by
performances in Egypt and Australia.
In Egypt, service revenue growth was 31.2% at constant exchange rates, benefiting
from a 52.7% increase in the average customer base and an increase in voice revenue,
with the fall in the effective rate per minute being offset by a 60.1% increase in usage.
The success of recent prepaid customer offerings, such as the Vodafone Family tariff,
contributed to the 45.8% growth in closing customers compared to the 2007
financial year.
In Australia, service revenue grew by 7.5% at constant exchange rates, which was
achieved despite the sharp regulatory driven decline in termination rates during the
year. Revenue growth in Australia reflected an 8.0% increase in the average customer
base and the mix of higher value contract customers. New Zealand also saw strong
growth in service revenue, which increased by 20.0%, or by 10.1% at constant
exchange rates, driven primarily by a 16.7% increase in the average contract customer
base and strong growth in data and fixed line revenue.
EBITDA grew by 6.2%, or by 14.3% on an organic basis, with the main drivers of growth
being Egypt and Australia.
In Egypt, EBITDA increased by 20.6% at constant exchange rates. Direct costs grew
due to prepaid airtime commission increases and 3G licence costs. Within operating
expenses, staff investment programmes, higher publicity costs and leased line costs
increased during the year, although operating expenses remained stable as a
percentage of service revenue.
The favourable performance in Australia was a result of the higher contract customer
base, achieved through expansion of retail distribution, with higher contract revenue
offsetting the increase in customer costs.
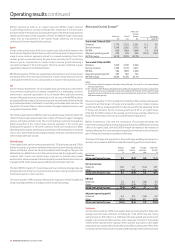
Verizon Wireless
2008 2007 % change
£m £m £ $
Revenue 10,144 9,387 8.1 14.5
Service revenue 9,246 8,507 8.7 15.2
EBITDA 3,930 3,614 8.7 15.3
Interest (102) (179) (43.0)
Tax(1) (166) (125) 32.8
Minority interest (56) (61) (8.2)
Group’s share of result in
Verizon Wireless 2,447 2,077 17.8 24.8
Note:
(1) The Group’s share of the tax attributable to Verizon Wireless relates only to the corporate
entities held by the Verizon Wireless partnership and certain state taxes which are levied on
the partnership.
Verizon Wireless increased its closing customer base by 10.6% in the year ended
31 March 2008, adding 6.5 million net additions to reach a total customer base of
67.2 million. The performance was particularly robust in the higher value contract
segment and was achieved in a market where the estimated mobile penetration
reached 88% at 31 March 2008.
The strong customer growth was achieved through a combination of higher gross
additions and Verizon Wireless’ strong customer loyalty, with the latter evidenced
through continuing low levels of churn. The 12.3% growth in the average mobile
customer base combined with a 2.7% increase in ARPU resulted in a 15.2% increase
in service revenue. ARPU growth was achieved through the continued success
of non-voice services, driven predominantly by data cards, wireless email and
messaging services. Verizon Wireless’ operating profit was impacted by efficiencies
in other direct costs and operating expenses, partly offset by a higher level of
customer acquisition and retention costs.
During the 2008 financial year, Verizon Wireless consolidated its spectrum position
through the Federal Communications Commission’s Auction 73, winning the auction
for a nationwide spectrum footprint plus licences for individual markets for
US$9.4 billion, which was fully funded by debt. This spectrum depth will allow Verizon
Wireless to continue to grow revenue, to preserve its reputation as the nation’s most
reliable wireless network, and to continue to lead in data services to satisfy the next
wave of services and consumer electronics devices.
The Group’s share of the tax attributable to Verizon Wireless for the year ended
31 March 2008 relates only to the corporate entities held by the Verizon Wireless
partnership. The tax attributable to the Group’s share of the partnership’s pre-tax
profit is included within the Group tax charge.
Operating results continued