Vodafone 2009 Annual Report Download - page 90
Download and view the complete annual report
Please find page 90 of the 2009 Vodafone annual report below. You can navigate through the pages in the report by either clicking on the pages listed below, or by using the keyword search tool below to find specific information within the annual report.-
 1
1 -
2
-
3
-
4
-
5
-
6
-
7
-
8
-
9
-
10
-
11
-
12
-
13
-
14
-
15
-
16
-
17
-
18
-
19
-
20
-
21
-
22
-
23
-
24
-
25
-
26
-
27
-
28
-
29
-
30
-
31
-
32
-
33
-
34
-
35
-
36
-
37
-
38
-
39
-
40
-
41
-
42
-
43
-
44
-
45
-
46
-
47
-
48
-
49
-
50
-
51
-
52
-
53
-
54
-
55
-
56
-
57
-
58
-
59
-
60
-
61
-
62
-
63
-
64
-
65
-
66
-
67
-
68
-
69
-
70
-
71
-
72
-
73
-
74
-
75
-
76
-
77
-
78
-
79
-
 80
80 -
 81
81 -
 82
82 -
 83
83 -
 84
84 -
 85
85 -
 86
86 -
 87
87 -
 88
88 -
 89
89 -
 90
90 -
 91
91 -
 92
92 -
 93
93 -
 94
94 -
 95
95 -
 96
96 -
 97
97 -
 98
98 -
 99
99 -
 100
100 -
101
-
102
-
103
-
104
-
105
-
106
-
107
-
108
-
109
-
110
-
111
-
112
-
113
-
114
-
115
-
116
-
117
-
118
-
119
-
120
-
121
-
122
-
123
-
124
-
125
-
126
-
127
-
128
-
129
-
130
-
131
-
132
-
133
-
134
-
135
-
136
-
137
-
138
-
139
-
140
-
141
-
142
-
143
-
144
-
145
-
146
-
147
-
148
 |
 |

88 Vodafone Group Plc Annual Report 2009
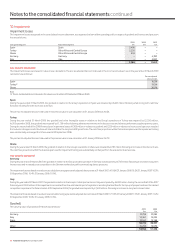
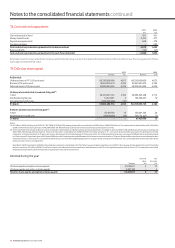
6. Taxation continued
At 31 March 2009, the gross amount and expiry dates of losses available for carry forward are as follows:
Expiring Expiring
within within
5 years 6-10 years Unlimited Total
£m £m £m £m
Losses for which a deferred tax asset is recognised 2 − 343 345
Losses for which no deferred tax is recognised 908 366 81,845 83,119
910 366 82,188 83,464
Included above are losses amounting to £1,940 million (2008: £1,969 million) in respect of UK subsidiaries which are only available for offset against future capital gains and
since it is uncertain whether these losses will be utilised, no deferred tax asset has been recognised.
The losses above also include £77,780 million (2008: £82,204 million) that have arisen in overseas holding companies as a result of revaluations of those companies’
investments for local GAAP purposes. Since it is uncertain whether these losses will be utilised, no deferred tax asset has been recognised.
In addition to the losses described above, the Group has potential tax losses of £46,716 million (2008: £40,181 million) in respect of a write down in the value of investments
in Germany. These losses have to date been denied by the German tax authorities. The outcome of the ongoing tax audit and the timing of the resolution are not yet known.
The Group has not recognised the availability of the losses, nor the income statement benefit arising from them, due to this uncertainty. If upon resolution a benefit is
recognised, it may impact both the amount of current income taxes provided since the date of initial deduction and the amount of the benefit from tax losses the Group will
recognise. The recognition of these benefits could affect the overall profitability of the Group in future periods. The £6,535 million increase compared to the position at
31 March 2008 is due to foreign exchange.
The Group holds provisions in respect of deferred taxation that would arise if temporary differences on investments in subsidiaries, associates and interests in joint ventures
were to be realised after the balance sheet date. No deferred tax liability has been recognised in respect of a further £63,551 million (2008: £49,000 million) of unremitted
earnings of subsidiaries, associates and joint ventures because the Group is in a position to control the timing of the reversal of the temporary difference and it is probable
that such differences will not reverse in the foreseeable future. It is not practicable to estimate the amount of unrecognised deferred tax liabilities in respect of these
unremitted earnings.
7. Equity dividends
2009 2008 2007
£m £m £m
Declared during the financial year:
Final dividend for the year ended 31 March 2008: 5.02 pence per share
(2007: 4.41 pence per share, 2006: 3.87 pence per share) 2,667 2,331 2,328
Interim dividend for the year ended 31 March 2009: 2.57 pence per share
(2008: 2.49 pence per share, 2007: 2.35 pence per share) 1,350 1,322 1,238
4,017 3,653 3,566
Proposed after the balance sheet date and not recognised as a liability:
Final dividend for the year ended 31 March 2009: 5.20 pence per share
(2008: 5.02 pence per share, 2007: 4.41 pence per share) 2,731 2,667 2,331
8. Earnings/(loss) per share
Restated
2009 2008 2007
Millions Millions Millions
Weighted average number of shares for basic earnings/(loss) per share 52,737 53,019 55,144
Effect of dilutive potential shares: restricted shares and share options(1) 232 268 −
Weighted average number of shares for diluted earnings/(loss) per share 52,969 53,287 55,144
£m £m £m
Earnings/(loss) for basic and diluted earnings per share:
Continuing operations 3,078 6,660 (4,932)
Discontinued operations(2) − − (419)
Total 3,078 6,660 (5,351)
Notes:
(1) In the year ended 31 March 2007, 215 million shares have been excluded from the calculation of diluted loss per share as they are not dilutive.
(2) See note 30 for further information on discontinued operations, including the per share effect of discontinued operations.
Notes to the consolidated nancial statements continued