Vodafone 2009 Annual Report Download - page 95
Download and view the complete annual report
Please find page 95 of the 2009 Vodafone annual report below. You can navigate through the pages in the report by either clicking on the pages listed below, or by using the keyword search tool below to find specific information within the annual report.-
 1
1 -
2
-
3
-
4
-
5
-
6
-
7
-
8
-
9
-
10
-
11
-
12
-
13
-
14
-
15
-
16
-
17
-
18
-
19
-
20
-
21
-
22
-
23
-
24
-
25
-
26
-
27
-
28
-
29
-
30
-
31
-
32
-
33
-
34
-
35
-
36
-
37
-
38
-
39
-
40
-
41
-
42
-
43
-
44
-
45
-
46
-
47
-
48
-
49
-
50
-
51
-
52
-
53
-
54
-
55
-
56
-
57
-
58
-
59
-
60
-
61
-
62
-
63
-
64
-
65
-
66
-
67
-
68
-
69
-
70
-
71
-
72
-
73
-
74
-
75
-
76
-
77
-
78
-
79
-
80
-
81
-
82
-
83
-
84
-
 85
85 -
 86
86 -
 87
87 -
 88
88 -
 89
89 -
 90
90 -
 91
91 -
 92
92 -
 93
93 -
 94
94 -
 95
95 -
 96
96 -
 97
97 -
 98
98 -
 99
99 -
 100
100 -
 101
101 -
 102
102 -
 103
103 -
 104
104 -
 105
105 -
106
-
107
-
108
-
109
-
110
-
111
-
112
-
113
-
114
-
115
-
116
-
117
-
118
-
119
-
120
-
121
-
122
-
123
-
124
-
125
-
126
-
127
-
128
-
129
-
130
-
131
-
132
-
133
-
134
-
135
-
136
-
137
-
138
-
139
-
140
-
141
-
142
-
143
-
144
-
145
-
146
-
147
-
148
 |
 |

Financials
Vodafone Group Plc Annual Report 2009 93
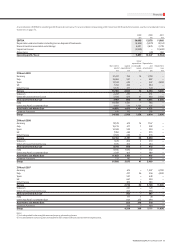
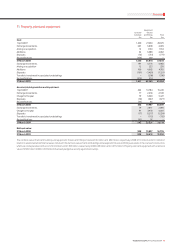
11. Property, plant and equipment
Equipment
Land and fixtures
buildings and fittings Total
£m £m £m
Cost:
1 April 2007 1,240 27,430 28,670
Exchange movements 201 3,898 4,099
Arising on acquisition 14 1,150 1,164
Additions 94 3,988 4,082
Disposals (10) (761) (771)
Reclassifications (109) 109 –
31 March 2008 1,430 35,814 37,244
Exchange movements 191 4,775 4,966
Arising on acquisition 15 223 238
Additions 100 4,665 4,765
Disposals (101) (1,450) (1,551)
Transfer to investment in associated undertakings – (298) (298)
Reclassifications (214) 214 –
31 March 2009 1,421 43,943 45,364
Accumulated depreciation and impairment:
1 April 2007 442 14,784 15,226
Exchange movements 77 2,456 2,533
Charge for the year 79 3,348 3,427
Disposals (10) (667) (677)
Reclassifications (66) 66 –
31 March 2008 522 19,987 20,509
Exchange movements 79 2,811 2,890
Charge for the year 91 3,970 4,061
Disposals (17) (1,217) (1,234)
Transfer to investment in associated undertakings – (112) (112)
Reclassifications (92) 92 –
31 March 2009 583 25,531 26,114
Net book value:
31 March 2008 908 15,827 16,735
31 March 2009 838 18,412 19,250
The net book value of land and buildings and equipment, fixtures and fittings includes £106 million and £82 million, respectively (2008: £110 million and £51 million) in
relation to assets held under finance leases. Included in the net book value of land and buildings and equipment, fixtures and f ittings are assets in the course of construction,
which are not depreciated, with a cost of £44 million and £1,186 million, respectively (2008: £28 million and £1,013 million). Property, plant and equipment with a net book
value of £148 million (2008: £1,503 million) has been pledged as security against borrowings.