Vodafone 2009 Annual Report Download - page 104
Download and view the complete annual report
Please find page 104 of the 2009 Vodafone annual report below. You can navigate through the pages in the report by either clicking on the pages listed below, or by using the keyword search tool below to find specific information within the annual report.-
 1
1 -
2
-
3
-
4
-
5
-
6
-
7
-
8
-
9
-
10
-
11
-
12
-
13
-
14
-
15
-
16
-
17
-
18
-
19
-
20
-
21
-
22
-
23
-
24
-
25
-
26
-
27
-
28
-
29
-
30
-
31
-
32
-
33
-
34
-
35
-
36
-
37
-
38
-
39
-
40
-
41
-
42
-
43
-
44
-
45
-
46
-
47
-
48
-
49
-
50
-
51
-
52
-
53
-
54
-
55
-
56
-
57
-
58
-
59
-
60
-
61
-
62
-
63
-
64
-
65
-
66
-
67
-
68
-
69
-
70
-
71
-
72
-
73
-
74
-
75
-
76
-
77
-
78
-
79
-
80
-
81
-
82
-
83
-
84
-
85
-
86
-
87
-
88
-
89
-
90
-
91
-
92
-
93
-
 94
94 -
 95
95 -
 96
96 -
 97
97 -
 98
98 -
 99
99 -
 100
100 -
 101
101 -
 102
102 -
 103
103 -
 104
104 -
 105
105 -
 106
106 -
 107
107 -
 108
108 -
 109
109 -
 110
110 -
 111
111 -
 112
112 -
 113
113 -
 114
114 -
115
-
116
-
117
-
118
-
119
-
120
-
121
-
122
-
123
-
124
-
125
-
126
-
127
-
128
-
129
-
130
-
131
-
132
-
133
-
134
-
135
-
136
-
137
-
138
-
139
-
140
-
141
-
142
-
143
-
144
-
145
-
146
-
147
-
148
 |
 |

102 Vodafone Group Plc Annual Report 2009
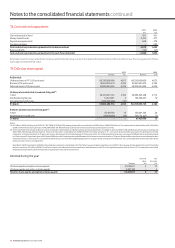
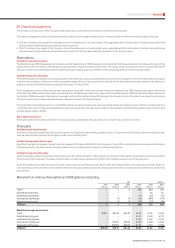
24. Capital and nancial risk management
Capital management
The following table summarises the capital of the Group:
2009 2008
£m £m
Cash and cash equivalents (4,878) (1,699)
Derivative financial instruments (2,272) (348)
Borrowings 41,373 27,194
Net debt 34,223 25,147
Equity 84,777 76,471
Capital 119,000 101,618
The Group’s policy is to borrow centrally, using a mixture of long term and short term
capital market issues and borrowing facilities, to meet anticipated funding
requirements. These borrowings, together with cash generated from operations, are
loaned internally or contributed as equity to certain subsidiaries. The Board has
approved three internal debt protection ratios, being: net interest to operating cash flow
(plus dividends from associated undertakings); retained cash flow (operating cash
flow plus dividends from associated undertakings less interest, tax, dividends to
minorities and equity dividends) to net debt; and operating cash flow (plus dividends
from associated undertakings) to net debt. These internal ratios establish levels of debt
that the Group should not exceed other than for relatively short periods of time and are
shared with the Group’s debt rating agencies, being Moody’s, Fitch Ratings and Standard
& Poor’s. The Group complied with these ratios throughout the financial year.
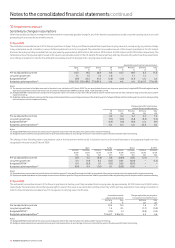
Financial risk management
The Group’s treasury function provides a centralised service to the Group for funding,
foreign exchange, interest rate management and counterparty risk management.
Treasury operations are conducted within a framework of policies and guidelines
authorised and reviewed annually by the Board, most recently on 23 September 2008.
A treasury risk committee, comprising of the Group’s Chief Financial Officer, Group
General Counsel and Company Secretary, Corporate Finance Director and Director of
Financial Reporting, meets at least annually to review treasury activities and its
members receive management information relating to treasury activities on a quarterly
basis. The Group accounting function, which does not report to the Group Corporate
Finance Director, provides regular update reports of treasury activity to the Board. The
Group’s internal auditors review the internal control environment regularly.
The Group uses a number of derivative instruments that are transacted, for currency
and interest rate risk management purposes only, by specialist treasury personnel.
In light of the current financial crisis within the banking sector, the Group has
reviewed the types of financial risk it faces and continues to monitor these on an
ongoing basis. The Group considers that credit risk has increased in the banking
sector and has mitigated this risk by the introduction of collateral support agreements
for certain counterparties.
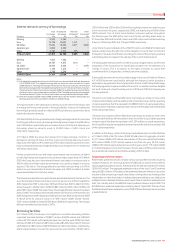
Credit risk
The Group considers its exposure to credit risk at 31 March to be as follows:
2009 2008
£m £m
Bank deposits 811 451
Repurchase agreements 648 478
Money market fund investments 3,419 477
Commercial paper investments – 293
Derivative financial instruments 2,707 892
Other investments – debt and bonds 2,114 1,376
Trade receivables 3,807 3,598
13,506 7,565
Money market investments are in accordance with established internal treasury
policies which dictate that an investment’s long term credit rating is no lower than
single A. Additionally, the Group invests in AAA unsecured money market mutual
funds where the investment is limited to 10% of each fund.
The Group has investments in repurchase agreements which are fully collateralised
investments. The collateral is sovereign and supranational debt of major EU countries
denominated in euros and US dollars and can be readily converted to cash. In the
event of any default, ownership of the collateral would revert to the Group. Detailed
below is the value of the collateral held by the Group at 31 March 2009:
2009 2008
£m £m
Sovereign 544 418
Supranational 104 60
648 478
In respect of financial instruments used by the Group’s treasury function, the
aggregate credit risk the Group may have with one counterparty is limited by firstly,
reference to the long term credit ratings assigned for that counterparty by Moody’s,
Fitch Ratings and Standard & Poor’s and secondly, as a consequence of collateral
support agreements introduced from the fourth quarter of 2008. Under collateral
support agreements, the Group’s exposure to a counterparty with whom a collateral
support agreement is in place is reduced to the extent that the counterparty must
post cash collateral when there is value due to the Group under outstanding
derivative contracts that exceeds a contractually agreed threshold amount. When
value is due to the counterparty, the Group is required to post collateral on identical
terms. Such cash collateral is adjusted daily as necessary.
In the event of any default, ownership of the cash collateral would revert to the
respective holder at that point. Detailed below is the value of the cash collateral,
which is reported within short term borrowings, held by the Group at 31 March 2009:
2009 2008
£m £m
Cash collateral 691 –
The majority of the Group’s trade receivables are due for maturity within 90 days and
largely comprise amounts receivable from consumers and business customers. At
31 March 2009, £1,987 million (2008: £1,546 million) of trade receivables were not
yet due for payment. Total trade receivables consisted of £2,798 million (2008:
£2,881 million) relating to the Europe region, £561 million (2008: £396 million)
relating to the Africa and Central Europe region and £448 million (2008: £321 million)
relating to the Asia Pacific and Middle East region. Accounts are monitored by
management and provisions for bad and doubtful debts raised where it is
deemed appropriate.
The following table present s ageing of receivables that are past due and are presented
net of provisions for doubtful receivables that have been established.
2009 2008
£m £m
30 days or less 1,430 1,714
Between 31 – 60 days 131 117
Between 61 – 180 days 121 115
Greater than 180 days 138 106
1,820 2,052
Concentrations of credit risk with respect to trade receivables are limited given that
the Group’s customer base is large and unrelated. Due to this, management believes
there is no further credit risk provision required in excess of the normal provision for
bad and doubtful receivables. Amounts charged to administrative expenses
during the year ended 31 March 2009 were £423 million (2008: £293 million, 2007:
£201 million) (see note 17).
The Group has other investments in preferred equity and a subordinated loan
received as part of the disposal of Vodafone Japan to SoftBank in the 2007 financial
year. The carrying value of those investments at 31 March 2009 was £2,073 million
(2008: £1,346 million).
Notes to the consolidated nancial statements continued