Vodafone 2009 Annual Report Download - page 146
Download and view the complete annual report
Please find page 146 of the 2009 Vodafone annual report below. You can navigate through the pages in the report by either clicking on the pages listed below, or by using the keyword search tool below to find specific information within the annual report.-
 1
1 -
2
-
3
-
4
-
5
-
6
-
7
-
8
-
9
-
10
-
11
-
12
-
13
-
14
-
15
-
16
-
17
-
18
-
19
-
20
-
21
-
22
-
23
-
24
-
25
-
26
-
27
-
28
-
29
-
30
-
31
-
32
-
33
-
34
-
35
-
36
-
37
-
38
-
39
-
40
-
41
-
42
-
43
-
44
-
45
-
46
-
47
-
48
-
49
-
50
-
51
-
52
-
53
-
54
-
55
-
56
-
57
-
58
-
59
-
60
-
61
-
62
-
63
-
64
-
65
-
66
-
67
-
68
-
69
-
70
-
71
-
72
-
73
-
74
-
75
-
76
-
77
-
78
-
79
-
80
-
81
-
82
-
83
-
84
-
85
-
86
-
87
-
88
-
89
-
90
-
91
-
92
-
93
-
94
-
95
-
96
-
97
-
98
-
99
-
100
-
101
-
102
-
103
-
104
-
105
-
106
-
107
-
108
-
109
-
110
-
111
-
112
-
113
-
114
-
115
-
116
-
117
-
118
-
119
-
120
-
121
-
122
-
123
-
124
-
125
-
126
-
127
-
128
-
129
-
130
-
131
-
132
-
133
-
134
-
135
-
 136
136 -
 137
137 -
 138
138 -
 139
139 -
 140
140 -
 141
141 -
 142
142 -
 143
143 -
 144
144 -
 145
145 -
 146
146 -
 147
147 -
 148
148
 |
 |

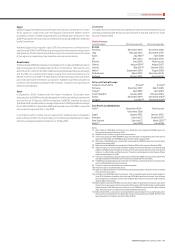
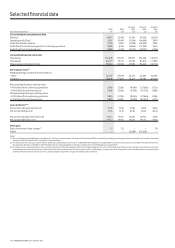
144 Vodafone Group Plc Annual Report 2009
Restated Restated Restated
2009 2008 2007 2006 2005
At/year ended 31 March £m £m £m £m £m
Consolidated income statement data
Revenue 41,017 35,478 31,104 29,350 26,678
Operating profit/(loss) 5,857 10,047 (1,564) (14,084) 7,878
Profit/(loss) before taxation 4,189 9,001 (2,383) (14,853) 7,285
Profit/(loss) for the financial year from continuing operations 3,080 6,756 (4,806) (17,233) 5,416
Profit/(loss) for the financial year 3,080 6,756 (5,222) (20,131) 6,598
Consolidated balance sheet data
Total assets 152,699 127,270 109,617 126,502 145,218
Total equity 84,777 76,471 67,293 85,312 111,958
Total equity shareholders’ funds 86,162 78,043 67,067 85,425 112,110
Earnings per share(1)
Weighted average number of shares (millions)
– Basic 52,737 53,019 55,144 62,607 66,196
– Diluted 52,969 53,287 55,144 62,607 66,427
Basic earnings/(loss) per ordinary share
– Profit/(loss) from continuing operations 5.84p 12.56p (8.94)p (27.66)p 8.12p
– Profit/(loss) for the financial year 5.84p 12.56p (9.70)p (32.31)p 9.80p
Diluted earnings/(loss) per ordinary share
– Profit/(loss) from continuing operations 5.81p 12.50p (8.94)p (27.66)p 8.09p
– Profit/(loss) for the financial year 5.81p 12.50p (9.70)p (32.31)p 9.77p
Cash dividends(1)(2)
Amount per ordinary share (pence) 7.77p 7.51p 6.76p 6.07p 4.07p
Amount per ADS (pence) 77.7p 75.1p 67.6p 60.7p 40.7p
Amount per ordinary share (US cents) 11.11c 14.91c 13.28c 10.56c 7.68c
Amount per ADS (US cents) 111.1c 149.1c 132.8c 105.6c 76.8c
Other data
Ratio of earnings to fixed charges(3) 1.2 3.9 – – 7.0
Deficit – – (4,389) (16,520) –
Notes:
(1) Se e note 8 to th e conso lidated financial statement s, “Earnings/( loss) pe r shar e”. Ea rn ings an d div idends per ADS is calcu lated by multiplying ear nings p er ordinar y share by ten , the num ber of ordinar y
shares per ADS. Dividend per ADS is calculated on the same basis.
(2) The final dividend for the year ended 31 March 2009 was proposed by the directors on 19 May 2009 and is payable on 7 August 2009 to holders of record as of 5 June 2009. This dividend has been
translated into US dollars at 31 March 2009 for ADS holders but will be payable in US dollars under the terms of the ADS depositary agreement.
(3) For the purposes of calculating these ratios, earnings consist of profit before tax adjusted for fixed charges, dividend income from associated undertakings, share of profits and losses from associated
undertakings and profits and losses on ordinary activities before taxation from discontinued operations. Fixed charges comprise one third of payments under operating leases, representing the
estimated interest element of these payments, interest payable and similar charges and preferred share dividends.
Selected nancial data