Vodafone 2009 Annual Report Download - page 84
Download and view the complete annual report
Please find page 84 of the 2009 Vodafone annual report below. You can navigate through the pages in the report by either clicking on the pages listed below, or by using the keyword search tool below to find specific information within the annual report.-
 1
1 -
2
-
3
-
4
-
5
-
6
-
7
-
8
-
9
-
10
-
11
-
12
-
13
-
14
-
15
-
16
-
17
-
18
-
19
-
20
-
21
-
22
-
23
-
24
-
25
-
26
-
27
-
28
-
29
-
30
-
31
-
32
-
33
-
34
-
35
-
36
-
37
-
38
-
39
-
40
-
41
-
42
-
43
-
44
-
45
-
46
-
47
-
48
-
49
-
50
-
51
-
52
-
53
-
54
-
55
-
56
-
57
-
58
-
59
-
60
-
61
-
62
-
63
-
64
-
65
-
66
-
67
-
68
-
69
-
70
-
71
-
72
-
73
-
 74
74 -
 75
75 -
 76
76 -
 77
77 -
 78
78 -
 79
79 -
 80
80 -
 81
81 -
 82
82 -
 83
83 -
 84
84 -
 85
85 -
 86
86 -
 87
87 -
 88
88 -
 89
89 -
 90
90 -
 91
91 -
 92
92 -
 93
93 -
 94
94 -
95
-
96
-
97
-
98
-
99
-
100
-
101
-
102
-
103
-
104
-
105
-
106
-
107
-
108
-
109
-
110
-
111
-
112
-
113
-
114
-
115
-
116
-
117
-
118
-
119
-
120
-
121
-
122
-
123
-
124
-
125
-
126
-
127
-
128
-
129
-
130
-
131
-
132
-
133
-
134
-
135
-
136
-
137
-
138
-
139
-
140
-
141
-
142
-
143
-
144
-
145
-
146
-
147
-
148
 |
 |

82 Vodafone Group Plc Annual Report 2009
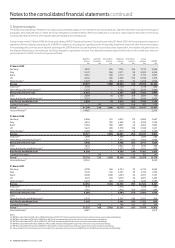
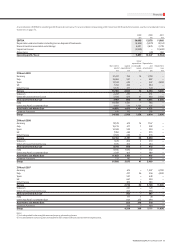
3. Segment analysis
The Group has a single group of related services and products, being the supply of communications services and products. Segment information is provided on the basis of
geographic areas, being the basis on which the Group manages its worldwide interests. Revenue is attributed to a country or region based on the location of the Group
company reporting the revenue. Inter-segment sales are charged at arm’s length prices.
During the year ended 31 March 2008, the Group early adopted IFRS 8 “Operating Segments”. During the year ended 31 March 2009, the Group changed its measure of
segment profit from adjusted operating profit to EBITDA. In addition to excluding non-operating income of associates, impairment losses and other income and expense
from operating profit, as in the case of adjusted operating profit, EBITDA further excludes the share of results of associates, depreciation, amortisation and gains/losses on
the disposal of fixed assets. During the year, the Group changed its organisation structure. The tables below present segment information on the revised basis, with prior
years amended to conform to the current year presentation.
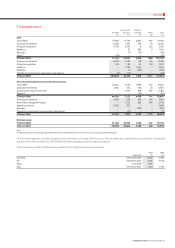
Segment Common Intra-region Regional Inter-region Group
revenue Functions revenue revenue revenue revenue EBITDA
£m £m £m £m £m £m £m
31 March 2009
Germany 7,847 (52) 7,795 (16) 7,779 3,058
Italy 5,547 (36) 5,511 (6) 5,505 2,424
Spain 5,812 (93) 5,719 (4) 5,715 1,897
UK 5,392 (46) 5,346 (10) 5,336 1,219
Other Europe(1) 5,329 (66) 5,263 (5) 5,258 1,824
Europe 29,927 (293) 29,634 (41) 29,593 10,422
Vodacom(2) 1,778 – 1,778 – 1,778 606
Other Africa and Central Europe(3) 3,723 – 3,723 (48) 3,675 1,084
Africa and Central Europe 5,501 – 5,501 (48) 5,453 1,690
India 2,689 (1) 2,688 (19) 2,669 710
Other Asia Pacific and Middle East(4) 3,131 – 3,131 (31) 3,100 1,029
Asia Pacific and Middle East 5,820 (1) 5,819 (50) 5,769 1,739
Common Functions(5) – 216 – 216 (14) 202 639
Group(6) 41,248 216 (294) 41,170 (153) 41,017 14,490
Verizon Wireless
(6)
14,085 5,543
31 March 2008
Germany 6,866 (51) 6,815 (11) 6,804 2,667
Italy 4,435 (33) 4,402 (6) 4,396 2,158
Spain 5,063 (96) 4,967 (4) 4,963 1,806
UK 5,424 (46) 5,378 (10) 5,368 1,431
Other Europe(1) 4,583 (64) 4,519 (3) 4,516 1,628
Europe 26,371 (290) 26,081 (34) 26,047 9,690
Vodacom(2) 1,609 – 1,609 – 1,609 586
Other Africa and Central Europe(3) 3,337 – 3,337 (35) 3,302 1,083
Africa and Central Europe 4,946 – 4,946 (35) 4,911 1,669
India 1,822 – 1,822 (12) 1,810 598
Other Asia Pacific and Middle East(4) 2,577 – 2,577 (26) 2,551 878
Asia Pacific and Middle East 4,399 – 4,399 (38) 4,361 1,476
Common Functions(5) – 170 – 170 (11) 159 343
Group(6) 35,716 170 (290) 35,596 (118) 35,478 13,178
Verizon Wireless
(6)
10,144 3,930
31 March 2007
Germany 6,790 (56) 6,734 (9) 6,725 2,696
Italy 4,245 (44) 4,201 (5) 4,196 2,149
Spain 4,500 (106) 4,394 (3) 4,391 1,567
UK 5,124 (54) 5,070 (9) 5,061 1,459
Other Europe(1) 4,275 (82) 4,193 (4) 4,189 1,530
Europe 24,934 (342) 24,592 (30) 24,562 9,401
Vodacom(2) 1,478 – 1,478 – 1,478 532
Other Africa and Central Europe(3) 2,616 – 2,616 (31) 2,585 893
Africa and Central Europe 4,094 – 4,094 (31) 4,063 1,425
India – – – – – –
Other Asia Pacific and Middle East(4) 2,347 – 2,347 (20) 2,327 826
Asia Pacific and Middle East 2,347 – 2,347 (20) 2,327 826
Common Functions(5) – 168 – 168 (16) 152 308
Group(6) 31,375 168 (342) 31,201 (97) 31,104 11,960
Verizon Wireless
(6)
9,387 3,614
Notes:
(1) EBITDA is stated before £520 million (2008: £425 million; 2007: £517 million) representing the Group’s share of results in associated undertakings.
(2) EBITDA is stated before £(1) million (2008: £nil; 2007: £nil) representing the Group’s share of results in associated undertakings.
(3) EBITDA is stated before £27 million (2008: £nil; 2007: £nil) representing the Group’s share of results in associated undertakings.
(4) EBITDA is stated before £4 million (2008: £2 million; 2007: £nil) representing the Group’s share of results in associated undertakings.
(5) EBITDA is stated before £(1) million (2008: £2 million; 2007: £1 million) relating to the Group’s share of results in associated undertakings.
(6) Values shown for Verizon Wireless are not included in the calculation of Group revenue or EBITDA as Verizon Wireless is an associated undertaking.
Notes to the consolidated nancial statements continued