Vodafone 2009 Annual Report Download - page 26
Download and view the complete annual report
Please find page 26 of the 2009 Vodafone annual report below. You can navigate through the pages in the report by either clicking on the pages listed below, or by using the keyword search tool below to find specific information within the annual report.-
 1
1 -
2
-
3
-
4
-
5
-
6
-
7
-
8
-
9
-
10
-
11
-
12
-
13
-
14
-
15
-
 16
16 -
 17
17 -
 18
18 -
 19
19 -
 20
20 -
 21
21 -
 22
22 -
 23
23 -
 24
24 -
 25
25 -
 26
26 -
 27
27 -
 28
28 -
 29
29 -
 30
30 -
 31
31 -
 32
32 -
 33
33 -
 34
34 -
 35
35 -
 36
36 -
37
-
38
-
39
-
40
-
41
-
42
-
43
-
44
-
45
-
46
-
47
-
48
-
49
-
50
-
51
-
52
-
53
-
54
-
55
-
56
-
57
-
58
-
59
-
60
-
61
-
62
-
63
-
64
-
65
-
66
-
67
-
68
-
69
-
70
-
71
-
72
-
73
-
74
-
75
-
76
-
77
-
78
-
79
-
80
-
81
-
82
-
83
-
84
-
85
-
86
-
87
-
88
-
89
-
90
-
91
-
92
-
93
-
94
-
95
-
96
-
97
-
98
-
99
-
100
-
101
-
102
-
103
-
104
-
105
-
106
-
107
-
108
-
109
-
110
-
111
-
112
-
113
-
114
-
115
-
116
-
117
-
118
-
119
-
120
-
121
-
122
-
123
-
124
-
125
-
126
-
127
-
128
-
129
-
130
-
131
-
132
-
133
-
134
-
135
-
136
-
137
-
138
-
139
-
140
-
141
-
142
-
143
-
144
-
145
-
146
-
147
-
148
 |
 |

24 Vodafone Group Plc Annual Report 2009
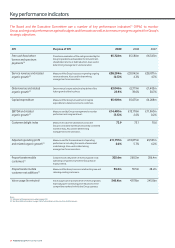
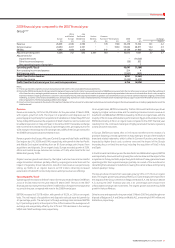
The Board and the Executive Committee use a number of key performance indicators(1) (‘KPIs’) to monitor
Group and regional performance against budgets and forecasts as well as to measure progress against the Group’s
strategic objectives.
Key performance indicators
KPI Purpose of KPI 2009 2008 2007
Free cash flow before
licence and spectrum
payments(2)
Provides an evaluation of the cash generated by the
Group’s operations and available for reinvestment,
shareholder returns or debt reduction. Also used in
determining management’s remuneration.
£5,722m £5,580m £6,343m
Service revenue and related
organic growth(2)
Measure of the Group’s success in growing ongoing
revenue streams. Also used in determining
management’s remuneration.
£38,294m
(0.3)%
£33,042m
4.3%
£28,871m
4.7%
Data revenue and related
organic growth(2)
Data revenue is expected to be a key driver of the
future growth of the business.
£3,046m
25.9%
£2,119m
39.0%
£1,405m
30.7%
Capital expenditure Measure of the Group’s investment in capital
expenditure to deliver services to customers.
£5,909m £5,075m £4,208m
EBITDA and related
organic growth(2)
Measure used by Group management to monitor
performance at a segment level.
£14,490m
(3.5)%
£13,178m
2.6%
£11,960m
0.2%
Customer delight index Measure of customer satisfaction across the
Group’s controlled markets and its jointly controlled
market in Italy. Also used in determining
management’s remuneration.
72.9 73.1 70.6
Adjusted operating profit
and related organic growth(2)
Measure used for the assessment of operating
performance, including the results of associated
undertakings. Also used in determining
management’s remuneration.
£11,757m
2.0%
£10,075m
5.7%
£9,531m
4.2%
Proportionate mobile
customers(1)
Customers are a key driver of revenue growth in all
operating companies in which the Group has an
equity interest.
302.6m 260.5m 206.4m
Proportionate mobile
customer net additions(1)
Measure of the Group’s success at attracting new and
retaining existing customers.
33.6m 39.5m 28.2m
Voice usage (in minutes) Voice usage is an important driver of revenue growth,
especially given continuing price reductions in the
competitive markets in which the Group operates.
548.4bn 427.9bn 245.0bn
Notes:
(1) Definition of the key terms is provided on page 143.
(2) See ‘Non-GAAP information’ on page 138 for further details on the use of non-GAAP measures.