Vodafone 2009 Annual Report Download - page 106
Download and view the complete annual report
Please find page 106 of the 2009 Vodafone annual report below. You can navigate through the pages in the report by either clicking on the pages listed below, or by using the keyword search tool below to find specific information within the annual report.-
 1
1 -
2
-
3
-
4
-
5
-
6
-
7
-
8
-
9
-
10
-
11
-
12
-
13
-
14
-
15
-
16
-
17
-
18
-
19
-
20
-
21
-
22
-
23
-
24
-
25
-
26
-
27
-
28
-
29
-
30
-
31
-
32
-
33
-
34
-
35
-
36
-
37
-
38
-
39
-
40
-
41
-
42
-
43
-
44
-
45
-
46
-
47
-
48
-
49
-
50
-
51
-
52
-
53
-
54
-
55
-
56
-
57
-
58
-
59
-
60
-
61
-
62
-
63
-
64
-
65
-
66
-
67
-
68
-
69
-
70
-
71
-
72
-
73
-
74
-
75
-
76
-
77
-
78
-
79
-
80
-
81
-
82
-
83
-
84
-
85
-
86
-
87
-
88
-
89
-
90
-
91
-
92
-
93
-
94
-
95
-
 96
96 -
 97
97 -
 98
98 -
 99
99 -
 100
100 -
 101
101 -
 102
102 -
 103
103 -
 104
104 -
 105
105 -
 106
106 -
 107
107 -
 108
108 -
 109
109 -
 110
110 -
 111
111 -
 112
112 -
 113
113 -
 114
114 -
 115
115 -
 116
116 -
117
-
118
-
119
-
120
-
121
-
122
-
123
-
124
-
125
-
126
-
127
-
128
-
129
-
130
-
131
-
132
-
133
-
134
-
135
-
136
-
137
-
138
-
139
-
140
-
141
-
142
-
143
-
144
-
145
-
146
-
147
-
148
 |
 |

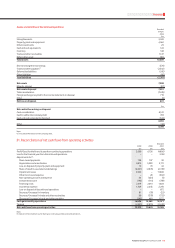
104 Vodafone Group Plc Annual Report 2009
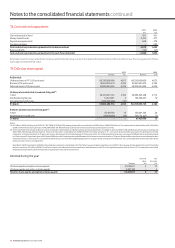
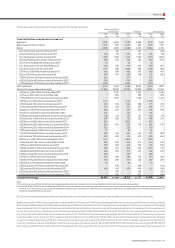
25. Borrowings
Carrying value and fair value information
2009 2008
Short term Long term Short term Long term
borrowings borrowings Total borrowings borrowings Total
£m £m £m £m £m £m
Financial liabilities measured at amortised cost:
Bank loans 893 5,159 6,052 806 2,669 3,475
Bank overdrafts 32 − 32 47 – 47
Redeemable preference shares – 1,453 1,453 – 985 985
Commercial paper 2,659 − 2,659 1,443 − 1,443
Bonds 515 8,064 8,579 1,125 4,439 5,564
Other liabilities(1) 1,015 4,122 5,137 306 3,005 3,311
Bonds in fair value hedge relationships 4,510 12,951 17,461 805 11,564 12,369
9,624 31,749 41,373 4,532 22,662 27,194
Note:
(1) At 31 March 2009, amount includes £691 million (2008: £nil) in relation to collateral support agreements.
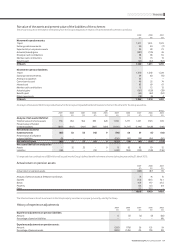
The fair value and carrying value of the Group’s short term borrowings is as follows:
Sterling equivalent
nominal value Fair value Carrying value
2009 2008 2009 2008 2009 2008
£m £m £m £m £m £m
Financial liabilities measured at amortised cost 5,131 3,731 5,108 3,715 5,114 3,727
Bonds in fair value hedge relationships: 4,320 802 4,397 800 4,510 805
4.25% euro 1,859 million bonds due May 2009 1,720 − 1,722 − 1,780 −
4.75% euro 859 million bond due May 2009 794 − 798 − 831 −
7.75% US dollar 2,582 million bond due February 2010 1,806 − 1,877 − 1,899 −
5.5% euro 400 million bond due July 2008 − 37 − 37 − 39
6.25% sterling 400 million bond due July 2008 − 400 − 400 − 397
6.65% US dollar 500 million bond due May 2008 − 126 − 126 − 130
4.0% euro 300 million bond due January 2009 − 239 − 237 − 239
Short term borrowings 9,451 4,533 9,505 4,515 9,624 4,532
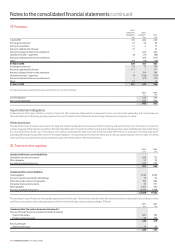
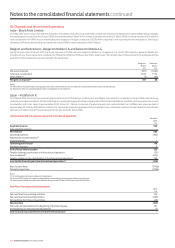
Notes to the consolidated nancial statements continued