Vodafone 2009 Annual Report Download - page 109
Download and view the complete annual report
Please find page 109 of the 2009 Vodafone annual report below. You can navigate through the pages in the report by either clicking on the pages listed below, or by using the keyword search tool below to find specific information within the annual report.-
 1
1 -
2
-
3
-
4
-
5
-
6
-
7
-
8
-
9
-
10
-
11
-
12
-
13
-
14
-
15
-
16
-
17
-
18
-
19
-
20
-
21
-
22
-
23
-
24
-
25
-
26
-
27
-
28
-
29
-
30
-
31
-
32
-
33
-
34
-
35
-
36
-
37
-
38
-
39
-
40
-
41
-
42
-
43
-
44
-
45
-
46
-
47
-
48
-
49
-
50
-
51
-
52
-
53
-
54
-
55
-
56
-
57
-
58
-
59
-
60
-
61
-
62
-
63
-
64
-
65
-
66
-
67
-
68
-
69
-
70
-
71
-
72
-
73
-
74
-
75
-
76
-
77
-
78
-
79
-
80
-
81
-
82
-
83
-
84
-
85
-
86
-
87
-
88
-
89
-
90
-
91
-
92
-
93
-
94
-
95
-
96
-
97
-
98
-
 99
99 -
 100
100 -
 101
101 -
 102
102 -
 103
103 -
 104
104 -
 105
105 -
 106
106 -
 107
107 -
 108
108 -
 109
109 -
 110
110 -
 111
111 -
 112
112 -
 113
113 -
 114
114 -
 115
115 -
 116
116 -
 117
117 -
 118
118 -
 119
119 -
120
-
121
-
122
-
123
-
124
-
125
-
126
-
127
-
128
-
129
-
130
-
131
-
132
-
133
-
134
-
135
-
136
-
137
-
138
-
139
-
140
-
141
-
142
-
143
-
144
-
145
-
146
-
147
-
148
 |
 |

Financials
Vodafone Group Plc Annual Report 2009 107
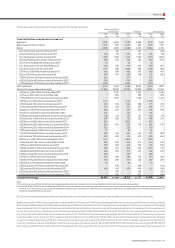
Interest rate and currency of borrowings
Total Floating rate Fixed rate Other
borrowings borrowings borrowings(1) borrowings(2)
Currency £m £m £m £m
Sterling 2,549 2,549 − −
Euro 15,126 13,605 1,521 −
US dollar 17,242 10,565 3,071 3,606
Japanese yen 2,660 2,660 − −
Other 3,796 3,323 473 −
31 March 2009 41,373 32,702 5,065 3,606
Sterling 1,563 1,563 – –
Euro 10,787 9,673 1,114 –
US dollar 10,932 8,456 – 2,476
Japanese yen 1,516 1,516 – –
Other 2,396 2,396 – –
31 March 2008 27,194 23,604 1,114 2,476
Notes:
(1) The weighted average interest rate for the Group’s euro denominated fixed rate borrowings
is 5.1% (2008: 5.1%). The weighted average time for which the rates are fixed is 6.7 years
(2008: 8.8 years). The weighted average interest rate for the Group’s US dollar denominated
fixed rate borrowings is 6.6%. The weighted average time for which the rates are fixed is 25.4 years.
The Group had no US dollar f ixed rate borrowi ngs in 20 08. The weig hted average interest rate for
the Group’s other currency fixed rate borrowings is 10.1%. The weighted average time for which
the rates are fixed is 2.5 years. The Group had no other currency fixed rate borrowings in 2008.
(2) Other borrowings of £3,606 million (2008: £2,476 million) are the liabilities arising under put
options granted over direct and indirect interests in Vodafone Essar.
The figures shown in the tables above take into account interest rate swaps used
to manage the interest rate profile of financial liabilities. Interest on floating rate
borrowings is generally based on national LIBOR equivalents or government bond
rates in the relevant currencies.
At 31 March 2009, the Group had entered into foreign exchange contracts to decrease
its sterling and other currency borrowings above by amounts equal to £6,039 million
and £1,204 million respectively and to increase its euro, US dollar and Japanese yen
borrowings above by amounts equal to £5,582 million, £1,400 million and
£194 million respectively.
At 31 March 2008, the Group had entered into foreign exchange contracts to
decrease its sterling, US dollar and other currency borrowings above by amounts
equal to £6,136 million, £2,916 million and £755 million respectively and to increase
its euro and Japanese yen borrowings above by amounts equal to £10,111 million and
£12 million respectively.
Further protection from euro and Indian rupee interest rate movements on debt is
provided by interest rate swaps and cross currency swaps, respectively. At 31 March
2009, the Group had euro denominated interest rate swaps for amounts equal to
£4,626 million and Indian rupee denominated cross currency swaps for amounts
equal to £125 million. The average effective rate which has been fixed, is 2.99% in
relation to euro denominated interest rate swaps and 6.89% in relation to Indian
rupee denominated cross currency swaps.
The Group has entered into euro and US dollar denominated interest rate futures. The
euro denominated interest rate futures cover the period June 2009 to September
2009, September 2009 to December 2009 and December 2009 to March 2010 for
amounts equal to £6,845 million (2008: £5,887 million), £6,061 million (2008: £nil)
and £3,931 million (2008: nil), respectively. The average effective rate which has been
fixed, is 3.96%. The US dollar denominated interest rate futures cover the period June
2009 to September 2009, September 2009 to December 2009 and December 2009
to March 2010 for amounts equal to £7,003 million (2008: £5,040 million),
£7,871 million (2008: £nil) and £9,333 million (2008: £nil), respectively. The average
effective rate which has been fixed, is 3.47%.
Borrowing facilities
At 31 March 2009, the Group’s most significant committed borrowing facilities
comprised two bank facilities of US$4,115 million (£2,878 million) and US$5,025
million (£3,514 million) both expiring between two and five years (2008: two bank
facilities of US$6,125 million (£3,083 million) and US$5,200 million (£2,617 million)),
a ¥259 billion (£1,820 million, 2008: ¥259 billion (£1,306 million)) term credit facility,
which expires between one and two years and two loan facilities of €400 million
(£370 million) and €350 million (£324 million) expiring between two and five years
and in more than five years, respectively (2008: one loan facility of €400 million
(£318 million)). The US dollar bank facilities remained undrawn throughout
the financial year, the ¥259 billion term credit facility was fully drawn down on
21 December 2005 and the €400 million and €350 million loan facilities were fully
drawn on 14 February 2007 and 12 August 2008, respectively.
Under the terms and conditions of the US$4,115 million and US$5,025 million bank
facilities, lenders have the right, but not the obligation, to cancel their commitment
30 days from the date of notification of a change of control of the Company and have
outstanding advances repaid on the last day of the current interest period.
The facility agreements provide for certain structural changes that do not affect the
obligations of the Company to be specifically excluded from the definition of a
change of control. This is in addition to the rights of lenders to cancel their
commitment if the Company has committed an event of default.
Substantially the same terms and conditions apply in the case of Vodafone Finance
K.K.’s ¥259 billion term credit facility, although the change of control provision is
applicable to any guarantor of borrowings under the term credit facility. Additionally,
the facility agreement requires Vodafone Finance K.K. to maintain a positive tangible
net worth at the end of each financial year. As of 31 March 2009, the Company was
the sole guarantor.
The terms and conditions of the €400 million loan facility are similar to those of the
US dollar bank facilities, with the addition that, should the Group’s Turkish operating
company spend less than the equivalent of US$800 million on capital expenditure,
the Group will be required to repay the drawn amount of the facility that exceeds 50%
of the capital expenditure.
The terms and conditions of the €350 million loan facility are similar to those of the
US dollar bank facilities, with the addition that, should the Group’s Italian operating
company spend less than the equivalent of €1,500 million on capital expenditure,
the Group will be required to repay the drawn amount of the facility that exceeds 18%
of the capital expenditure.
In addition to the above, certain of the Group’s subsidiaries had committed facilities
at 31 March 2009 of £4,725 million (2008: £2,548 million) in aggregate, of which
£1,571 million (2008: £473 million) was undrawn. Of the total committed facilities,
£675 million (2008: £1,031 million) expires in less than one year, £2,275 million
(2008: £743 million) expires between two and five years, and £1,775 million (2008:
£774 million) expires in more than five years. The increase in 2009 is predominantly
due to additional Vodafone Essar facilities totalling £1,875 million.
Redeemable preference shares
Redeemable preference shares comprise class D and E preferred shares issued by
Vodafone Americas, Inc. An annual dividend of US$51.43 per class D and E preferred
share is payable quarterly in arrears. The dividend for the year amounted to £51 million
(2008: £42 million). The aggregate redemption value of the class D and E preferred
shares is US$1.65 billion. The holders of the preferred shares are entitled to vote on the
election of directors and upon each other matter coming before any meeting of the
shareholders on which the holders of ordinary shares are entitled to vote. Holders are
entitled to vote on the basis of twelve votes for each share of class D or E preferred stock
held. The maturity date of the 825,000 class D preferred shares is 6 April 2020. The
825,000 class E preferred shares have a maturity date of 1 April 2020. The class D and
E preferred shares have a redemption price of US$1,000 per share plus all accrued and
unpaid dividends.