Vodafone 2009 Annual Report Download - page 85
Download and view the complete annual report
Please find page 85 of the 2009 Vodafone annual report below. You can navigate through the pages in the report by either clicking on the pages listed below, or by using the keyword search tool below to find specific information within the annual report.-
 1
1 -
2
-
3
-
4
-
5
-
6
-
7
-
8
-
9
-
10
-
11
-
12
-
13
-
14
-
15
-
16
-
17
-
18
-
19
-
20
-
21
-
22
-
23
-
24
-
25
-
26
-
27
-
28
-
29
-
30
-
31
-
32
-
33
-
34
-
35
-
36
-
37
-
38
-
39
-
40
-
41
-
42
-
43
-
44
-
45
-
46
-
47
-
48
-
49
-
50
-
51
-
52
-
53
-
54
-
55
-
56
-
57
-
58
-
59
-
60
-
61
-
62
-
63
-
64
-
65
-
66
-
67
-
68
-
69
-
70
-
71
-
72
-
73
-
74
-
 75
75 -
 76
76 -
 77
77 -
 78
78 -
 79
79 -
 80
80 -
 81
81 -
 82
82 -
 83
83 -
 84
84 -
 85
85 -
 86
86 -
 87
87 -
 88
88 -
 89
89 -
 90
90 -
 91
91 -
 92
92 -
 93
93 -
 94
94 -
 95
95 -
96
-
97
-
98
-
99
-
100
-
101
-
102
-
103
-
104
-
105
-
106
-
107
-
108
-
109
-
110
-
111
-
112
-
113
-
114
-
115
-
116
-
117
-
118
-
119
-
120
-
121
-
122
-
123
-
124
-
125
-
126
-
127
-
128
-
129
-
130
-
131
-
132
-
133
-
134
-
135
-
136
-
137
-
138
-
139
-
140
-
141
-
142
-
143
-
144
-
145
-
146
-
147
-
148
 |
 |

Financials
Vodafone Group Plc Annual Report 2009 83
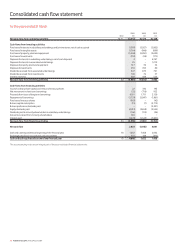
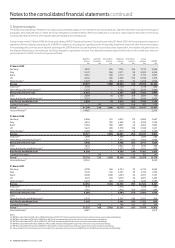
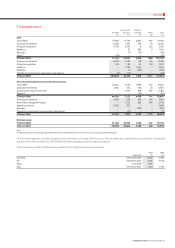
A reconciliation of EBITDA to operating profit/(loss) is shown below. For a reconciliation of operating profit/(loss) to profit/(loss) before taxation, see the consolidated income
statement on page 74.
2009 2008 2007
£m £m £m
EBITDA 14,490 13,178 11,960
Depreciation and amortisation including loss on disposal of fixed assets (6,824) (5,979) (5,154)
Share of results in associated undertakings 4,091 2,876 2,728
Impairment losses (5,900) – (11,600)
Other items – (28) 502
Operating profit/(loss) 5,857 10,047 (1,564)
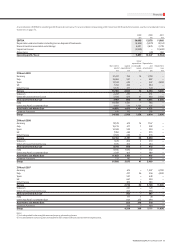
Other
expenditure Depreciation
Non-current Capital on intangible and Impairment
assets(1) expenditure(2) assets amortisation loss
£m £m £m £m £m
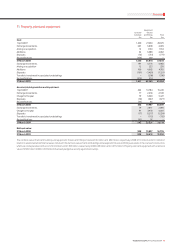
31 March 2009
Germany 21,617 750 16 1,318 –
Italy 18,666 521 – 687 –
Spain 13,324 632 – 567 3,400
UK 7,414 446 – 954 –
Other Europe 9,375 511 – 724 –
Europe 70,396 2,860 16 4,250 3,400
Vodacom 2,287 237 – 231 –
Other Africa and Central Europe 5,700 625 21 830 2,500
Africa and Central Europe 7,987 862 21 1,061 2,500
India 10,308 1,351 – 746 –
Other Asia Pacific and Middle East 4,687 524 1,101 475 –
Asia Pacific and Middle East 14,995 1,875 1,101 1,221 –
Common Functions 810 312 – 282 –
Group 94,188 5,909 1,138 6,814 5,900
31 March 2008
Germany 19,129 613 14 1,167 –
Italy 16,215 411 1 582 –
Spain 14,589 533 – 500 –
UK 7,930 465 – 973 –
Other Europe 8,303 469 11 616 –
Europe 66,166 2,491 26 3,838 –
Vodacom 1,676 204 2 219 –
Other Africa and Central Europe 7,075 702 5 694 –
Africa and Central Europe 8,751 906 7 913 –
India 8,835 1,030 – 562 –
Other Asia Pacific and Middle East 2,597 463 – 389 –
Asia Pacific and Middle East 11,432 1,493 – 951 –
Common Functions 717 185 8 207 –
Group 87,066 5,075 41 5,909 –
31 March 2007
Germany 614 – 1,207 6,700
Italy 421 26 556 4,900
Spain 547 – 449 –
UK 661 – 930 –
Other Europe 489 6 586 –
Europe 2,732 32 3,728 11,600
Vodacom 221 – 129 –
Other Africa and Central Europe 484 – 368 –
Africa and Central Europe 705 – 497 –
India 111 1 28 –
Other Asia Pacific and Middle East 444 275 290 –
Asia Pacific and Middle East 555 276 318 –
Common Functions 216 – 568 –
Group 4,208 308 5,111 11,600
Notes:
(1) Includes goodwill, other intangible assets and property, plant and equipment.
(2) Includes additions to property, plant and equipment and computer software, reported within intangible assets.