Vodafone 2009 Annual Report Download - page 108
Download and view the complete annual report
Please find page 108 of the 2009 Vodafone annual report below. You can navigate through the pages in the report by either clicking on the pages listed below, or by using the keyword search tool below to find specific information within the annual report.-
 1
1 -
2
-
3
-
4
-
5
-
6
-
7
-
8
-
9
-
10
-
11
-
12
-
13
-
14
-
15
-
16
-
17
-
18
-
19
-
20
-
21
-
22
-
23
-
24
-
25
-
26
-
27
-
28
-
29
-
30
-
31
-
32
-
33
-
34
-
35
-
36
-
37
-
38
-
39
-
40
-
41
-
42
-
43
-
44
-
45
-
46
-
47
-
48
-
49
-
50
-
51
-
52
-
53
-
54
-
55
-
56
-
57
-
58
-
59
-
60
-
61
-
62
-
63
-
64
-
65
-
66
-
67
-
68
-
69
-
70
-
71
-
72
-
73
-
74
-
75
-
76
-
77
-
78
-
79
-
80
-
81
-
82
-
83
-
84
-
85
-
86
-
87
-
88
-
89
-
90
-
91
-
92
-
93
-
94
-
95
-
96
-
97
-
 98
98 -
 99
99 -
 100
100 -
 101
101 -
 102
102 -
 103
103 -
 104
104 -
 105
105 -
 106
106 -
 107
107 -
 108
108 -
 109
109 -
 110
110 -
 111
111 -
 112
112 -
 113
113 -
 114
114 -
 115
115 -
 116
116 -
 117
117 -
 118
118 -
119
-
120
-
121
-
122
-
123
-
124
-
125
-
126
-
127
-
128
-
129
-
130
-
131
-
132
-
133
-
134
-
135
-
136
-
137
-
138
-
139
-
140
-
141
-
142
-
143
-
144
-
145
-
146
-
147
-
148
 |
 |
106 Vodafone Group Plc Annual Report 2009
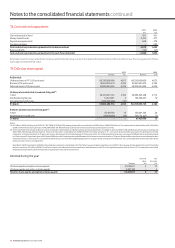
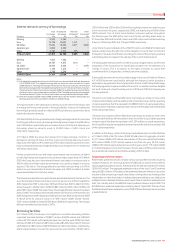
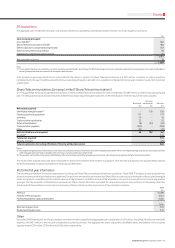
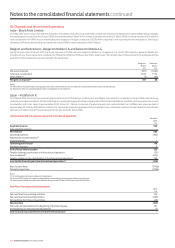
25. Borrowings continued
obligations comprising its physical assets and certain share pledges of the shares under VEL. The terms and conditions of the security arrangements mean that should
members of the VEL Group not meet all of their loan payment and performance obligations, the lenders may sell the pledged shares and/or assets to recover their losses,
with any remaining sales proceeds being returned to the VEL Group. Six of the eight legal entities within the VEL Group provide cross guarantees to the lenders.
Maturity of borrowings
The maturity profile of the anticipated future cash flows including interest in relation to the Group’s non-derivative financial liabilities on an undiscounted basis, which,
therefore, differs from both the carrying value and fair value, is as follows:
Redeemable Loans in fair
Bank preference Commercial Other value hedge
loans shares Paper Bonds liabilities relationships Total
£m £m £m £m £m £m £m
Within one year 950 127 2,670 787 1,053 5,222 10,809
In one to two years 2,361 97 – 283 3,663 1,808 8,212
In two to three years 665 59 – 2,105 25 1,443 4,297
In three to four years 525 59 – 269 314 1,589 2,756
In four to five years 1,345 59 – 1,064 252 2,118 4,838
In more than five years 342 1,517 – 7,360 71 8,928 18,218
6,188 1,918 2,670 11,868 5,378 21,108 49,130
Effect of discount/financing rates (136) (465) (11) (3,289) (209) (3,647) (7,757)
31 March 2009 6,052 1,453 2,659 8,579 5,169 17,461 41,373
Within one year 838 43 1,457 1,368 343 1,443 5,492
In one to two years 369 104 – 464 122 4,168 5,227
In two to three years 1,490 77 – 214 2,744 398 4,923
In three to four years 346 43 – 1,671 12 1,016 3,088
In four to five years 142 43 – 139 234 1,082 1,640
In more than five years 423 1,132 – 2,990 163 9,459 14,167
3,608 1,442 1,457 6,846 3,618 17,566 34,537
Effect of discount/financing rates (133) (457) (14) (1,282) (260) (5,197) (7,343)
31 March 2008 3,475 985 1,443 5,564 3,358 12,369 27,194
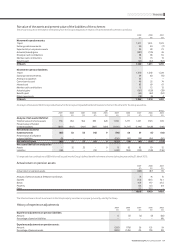
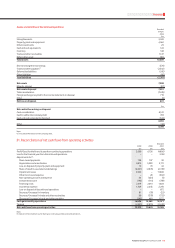
The maturity profile of the Group’s financial derivatives (which include interest rate and foreign exchange swaps), using undiscounted cash flows, is as follows:
2009 2008
Payable Receivable Payable Receivable
£m £m £m £m
Within one year 9,003 9,231 14,931 14,749
In one to two years 592 668 433 644
In two to three years 739 609 378 441
In three to four years 765 603 399 430
In four to five years 743 577 380 406
In more than five years 7,062 5,129 3,662 4,637
18,904 16,817 20,183 21,307
The currency split of the Group’s foreign exchange derivatives, all of which mature in less than one year, is as follows:
2009 2008
Payable Receivable Payable Receivable
£m £m £m £m
Sterling − 6,039 2,126 8,262
Euro 5,595 13 10,111 –
US dollar 2,527 1,127 2,076 4,992
Japanese yen 214 20 27 15
Other 81 1,285 42 797
8,417 8,484 14,382 14,066
Payables and receivables are stated separately in the table above as settlement is on a gross basis. The £67 million net receivable (2008: £316 million net payable)
in relation to foreign exchange financial instruments in the table above is split £37 million (2008: £358 million) within trade and other payables and £104 million
(2008: £42 million) within trade and other receivables.
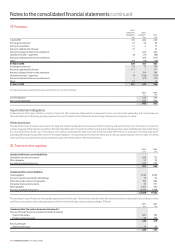
The present value of minimum lease payments under finance lease arrangements under which the Group has leased certain of its equipment is analysed as follows:
2009 2008
£m £m
Within one year 10 9
In two to five years 42 37
In more than five years 18 24
Notes to the consolidated nancial statements continued