Vodafone 2009 Annual Report Download - page 35
Download and view the complete annual report
Please find page 35 of the 2009 Vodafone annual report below. You can navigate through the pages in the report by either clicking on the pages listed below, or by using the keyword search tool below to find specific information within the annual report.-
 1
1 -
2
-
3
-
4
-
5
-
6
-
7
-
8
-
9
-
10
-
11
-
12
-
13
-
14
-
15
-
16
-
17
-
18
-
19
-
20
-
21
-
22
-
23
-
24
-
 25
25 -
 26
26 -
 27
27 -
 28
28 -
 29
29 -
 30
30 -
 31
31 -
 32
32 -
 33
33 -
 34
34 -
 35
35 -
 36
36 -
 37
37 -
 38
38 -
 39
39 -
 40
40 -
 41
41 -
 42
42 -
 43
43 -
 44
44 -
 45
45 -
46
-
47
-
48
-
49
-
50
-
51
-
52
-
53
-
54
-
55
-
56
-
57
-
58
-
59
-
60
-
61
-
62
-
63
-
64
-
65
-
66
-
67
-
68
-
69
-
70
-
71
-
72
-
73
-
74
-
75
-
76
-
77
-
78
-
79
-
80
-
81
-
82
-
83
-
84
-
85
-
86
-
87
-
88
-
89
-
90
-
91
-
92
-
93
-
94
-
95
-
96
-
97
-
98
-
99
-
100
-
101
-
102
-
103
-
104
-
105
-
106
-
107
-
108
-
109
-
110
-
111
-
112
-
113
-
114
-
115
-
116
-
117
-
118
-
119
-
120
-
121
-
122
-
123
-
124
-
125
-
126
-
127
-
128
-
129
-
130
-
131
-
132
-
133
-
134
-
135
-
136
-
137
-
138
-
139
-
140
-
141
-
142
-
143
-
144
-
145
-
146
-
147
-
148
 |
 |

Performance
Vodafone Group Plc Annual Report 2009 33
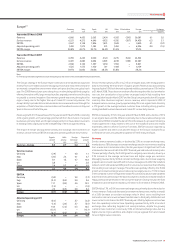
Europe(1)
Germany Italy Spain UK Other Eliminations Europe % change
£m £m £m £m £m £m £m £ Organic
Year ended 31 March 2008
Revenue 6,866 4,435 5,063 5,424 4,583 (290) 26,081 6.1 2 .0
Service revenue 6,551 4,273 4,646 4,952 4,295 (287) 24,430 6 .3 2.1
EBITDA 2,667 2,158 1,806 1,431 1,628 – 9,690 3.1 (0 .1)
Adjusted operating profit 1,490 1,573 1,282 431 1,430 – 6,206 0.8 (1.5)
EBITDA margin 38.8% 48.7% 35.7% 26.4% 35.5% 37.2%
Year ended 31 March 2007
Revenue 6,790 4,245 4,500 5,124 4,275 (342) 24,592
Service revenue 6,481 4,083 4,062 4,681 4,018 (338) 22,987
EBITDA 2,696 2,149 1,567 1,459 1,530 – 9,401
Adjusted operating profit 1,525 1,575 1,100 511 1,448 – 6,159
EBITDA margin 39.7% 50.6% 34.8% 28.5% 35.8% 38.2%
Note:
(1) The Group revised its segment structure during the year. See note 3 to the consolidated financial statements.
The Group’s strategy in the Europe region continued to drive additional usage and
revenue from core mobile voice and messaging services and reduce the cost base in
an intensely competitive environment where unit price declines are typical each
year. The 2008 financial year saw a strong focus on stimulating additional usage by
offering innovative tariffs, larger minute bundles, targeted promotions and focusing
on prepaid to contract migration. Data revenue growth was strong throughout the
region, mainly due to the higher take up of mobile PC connectivity devices. The
Group’s ability to provide total communications services was enhanced through the
acquisition of Tele2’s fixed line communication and broadband services in Italy and
Spain in the second half of the year.
Revenue growth of 6.1% was achieved for the year ended 31 March 2008, comprising
2.0% organic growth, a 0.7 percentage point benefit from the inclusion of acquired
businesses, primarily Tele2, and 3.4 percentage points from favourable movements
in exchange rates, largely due to the strengthening of the euro against sterling.
The impact of merger and acquisition activity and exchange rate movements on
revenue, service revenue, EBITDA and adjusted operating profit are shown below:
Organic M&A Foreign Reported
growth activity exchange growth
% pps pps %
Revenue – Europe 2.0 0.7 3.4 6.1
Service revenue
Germany (2.9) – 4.0 1.1
Italy (2.0) 2.6 4.1 4.7
Spain 8.1 1.6 4.7 14.4
UK 5.8 – – 5.8
Other 2.4 0.3 4.2 6.9
Europe 2.1 0.8 3.4 6.3
EBITDA
Germany (5.0) – 3.9 (1.1)
Italy (3.2) (0.2) 3.8 0.4
Spain 11.1 (0.4) 4.6 15.3
UK (1.9) – – (1.9)
Other 2.9 (0.3) 3.8 6.4
Europe (0.1) (0.2) 3.4 3.1
Adjusted operating profit
Germany (6.0) – 3.7 (2.3)
Italy (1.4) (2.4) 3.7 (0.1)
Spain 14.4 (2.2) 4.3 16.5
UK (15.7) – – (15.7)
Other (4.2) (0.5) 3.5 (1.2)
Europe (1.5) (1.1) 3.4 0.8
Service revenue grew by 6.3%, or by 2.1% on an organic basis, with strong growth in
data revenue being the main driver of organic growth. Revenue was also positively
impacted by the 9.3% rise in the total registered mobile customer base to 110.6 million
at 31 March 2008. These factors more than offset the negative effects of termination
rate cuts, the cancellation of top up fees on prepaid cards in Italy resulting from
new regulation issued in March 2007 and the Group’s ongoing reduction of European
roaming rates. Business segment service revenue, which represents 28% of
European service revenue, grew by approximately 5% on an organic basis, driven by
a 21% growth in the average business customer base, including strong growth in
closing handheld business devices and mobile PC connectivity devices.
EBITDA increased by 3.1% for the year ended 31 March 2008, with a decline of 0.1%
on an organic basis, and the difference primarily due to favourable exchange rate
movements. EBITDA included the benefit from the release of a provision following a
revised agreement in Italy related to the use of the Vodafone brand and related
trademarks, which is offset in Common Functions. EBITDA was also impacted by
higher customer and direct costs and the impact of the Group’s increased focus
on fixed line services, including the acquisition of Tele2 in Italy and Spain.
Germany
Service revenue remained stable, or declined by 2.9% at constant exchange rates,
mainly due to a 7.8% decrease at constant exchange rates in voice revenue resulting
from a reduction in termination rates, the full year impact of significant tariff cuts
introduced in the second half of the 2007 financial year and reduced roaming rates.
This was partially offset by the 34.4% growth in outgoing voice minutes, driven by a
9.1% increase in the average customer base and higher usage per customer.
Messaging revenue fell by 9.0% at constant exchange rates, due to lower usage by
prepaid customers and new tariffs with inclusive messages sent within the Vodafone
network, which stimulated an 8.8% growth in volumes, but was more than offset by
the resulting lower rate per message. These falls were partially offset by the 35.8%
growth at constant exchange rates in data revenue, largely due to a 71.9% increase
in the combined number of registered mobile PC connectivity devices and handheld
business devices, particularly in the business segment, as well as increased Vodafone
HappyLive! bundle penetration in the consumer segment. During the year, the fixed
broadband customer base increased by 0.5 million to 2.6 million at 31 March 2008.
EBITDA fell by 1.1%, or 5.0% at constant exchange rates, primarily due to the reduction
in voice revenue. Total costs decreased at constant exchange rates, mainly as a result
of a 3.6% decrease at constant exchange rates in direct costs resulting from
termination rate cuts as well as fewer handset sales to third party distributors and
lower content costs than in the 2007 financial year, offset by higher access line fees
from the expanding customer base. Operating expenses fell by 9.2% at constant
exchange rates, reflecting targeted cost saving initiatives, despite the growing
customer base. Customer costs rose by 5.0% at constant exchange rates, due to a
higher volume of gross additions and a higher cost per upgrade from an increased
focus on higher value customers.