Vodafone 2009 Annual Report Download - page 42
Download and view the complete annual report
Please find page 42 of the 2009 Vodafone annual report below. You can navigate through the pages in the report by either clicking on the pages listed below, or by using the keyword search tool below to find specific information within the annual report.-
 1
1 -
2
-
3
-
4
-
5
-
6
-
7
-
8
-
9
-
10
-
11
-
12
-
13
-
14
-
15
-
16
-
17
-
18
-
19
-
20
-
21
-
22
-
23
-
24
-
25
-
26
-
27
-
28
-
29
-
30
-
31
-
 32
32 -
 33
33 -
 34
34 -
 35
35 -
 36
36 -
 37
37 -
 38
38 -
 39
39 -
 40
40 -
 41
41 -
 42
42 -
 43
43 -
 44
44 -
 45
45 -
 46
46 -
 47
47 -
 48
48 -
 49
49 -
 50
50 -
 51
51 -
 52
52 -
53
-
54
-
55
-
56
-
57
-
58
-
59
-
60
-
61
-
62
-
63
-
64
-
65
-
66
-
67
-
68
-
69
-
70
-
71
-
72
-
73
-
74
-
75
-
76
-
77
-
78
-
79
-
80
-
81
-
82
-
83
-
84
-
85
-
86
-
87
-
88
-
89
-
90
-
91
-
92
-
93
-
94
-
95
-
96
-
97
-
98
-
99
-
100
-
101
-
102
-
103
-
104
-
105
-
106
-
107
-
108
-
109
-
110
-
111
-
112
-
113
-
114
-
115
-
116
-
117
-
118
-
119
-
120
-
121
-
122
-
123
-
124
-
125
-
126
-
127
-
128
-
129
-
130
-
131
-
132
-
133
-
134
-
135
-
136
-
137
-
138
-
139
-
140
-
141
-
142
-
143
-
144
-
145
-
146
-
147
-
148
 |
 |

40 Vodafone Group Plc Annual Report 2009
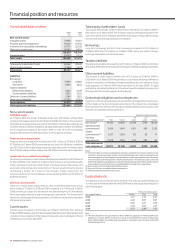
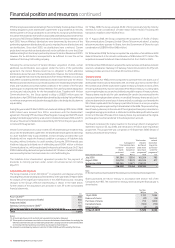
Consolidated balance sheet
2009 2008
£m £m
Non-current assets
Intangible assets 74,938 70,331
Property, plant and equipment 19,250 16,735
Investments in associated undertakings 34,715 22,545
Other non-current assets 10,767 8,935
139,670 118,546
Current assets 13,029 8,724
Total assets 152,699 127,270
Total equity shareholders’ funds 86,162 78,043
Total minority interests (1,385) (1,572)
Total equity 84,777 76,471
Liabilities
Borrowings
Long term 31,749 22,662
Short term 9,624 4,532
Taxation liabilities
Deferred tax liabilities 6,642 5,109
Current taxation liabilities 4,552 5,123
Other non-current liabilities 1,584 1,055
Other current liabilities 13,771 12,318
Total liabilities 67,922 50,799
Total equity and liabilities 152,699 127,270
Non-current assets
Intangible assets
At 31 March 2009, the Group’s intangible assets were £74.9 billion, with goodwill
comprising the largest element at £54.0 billion (2008: £51.3 billion). The increase in
intangible assets was primarily as a result of £10.0 billion of favourable exchange rate
movements and £2.3 billion of additions, partially offset by amortisation of £2.8 billion
and an impairment charge of £5.9 billion. Refer to note 10 to the consolidated
financial statements for further information on the impairment charge.
Property, plant and equipment
Property, plant and equipment increased from £16.7 billion at 31 March 2008 to
£19.3 billion at 31 March 2009, predominantly as a result of £4.8 billion of additions
and £2.1 billion of favourable foreign exchange movements, which more than offset
the £4.1 billion of depreciation charges and a £0.3 billion reduction due to disposals.
Investments in associated undertakings
The Group’s investments in associated undertakings increased from £22.5 billion at
31 March 2008 to £34.7 billion at 31 March 2009, mainly as a result of favourable
foreign exchange movements of £8.7 billion. The Group’s share of the results of its
associated undertakings, after deductions of interest, tax and minority interest,
contributed a further £4.1 billion to the increase, mainly arising from the
Group’s investment in Verizon Wireless, and was partially offset by £0.8 billion of
dividends received.
Other non-current assets
Other non-current assets mainly relate to other investments held by the Group,
which totalled £7.1 billion at 31 March 2009 compared to £7.4 billion at 31 March
2008, primarily as a result of a decrease in the listed share price of China Mobile,
which was largely offset by foreign exchange rate movements. The movement in
other non-current assets primarily represents a £1.6 billion increase in the revaluation
of financial instruments.
Current assets
Current assets increased to £13.0 billion at 31 March 2009 from £8.7 billion at
31 March 2008, mainly as a result of the increased holdings due to funding requirements
in relation to the completion of the Vodacom transaction and in anticipation of bond
redemptions occurring in May 2009.
Total equity shareholders’ funds
Total equity shareholders’ funds increased from £78.0 billion at 31 March 2008 to
£86.2 billion at 31 March 2009. The increase comprises primarily the profit for the
year of £3.1 billion and a £12.6 billion benefit from the impact of favourable exchange
rate movements less equity dividends of £4.0 billion.
Borrowings
Long term borrowings and short term borrowings increased to £41.4 billion at
31 March 2009 from £27.2 billion at 31 March 2008, mainly as a result of foreign
exchange movements and new bond issues.
Taxation liabilities
The deferred tax liability increased from £5.1 billion at 31 March 2008 to £6.6 billion
at 31 March 2009, which arose mainly from the impact of foreign exchange movements.
Other current liabilities
The increase in other current liabilities from £12.3 billion at 31 March 2008 to
£13.8 billion at 31 March 2009 was primarily to due foreign exchange differences
arising on translation of liabilities in foreign subsidiaries and joint ventures. Group
trade payables at 31 March 2009 were equivalent to 38 days (2008: 37 days)
outstanding, calculated by reference to the amount owed to suppliers as a proportion
of the amounts invoiced by suppliers during the year.
Contractual obligations and contingencies
A summary of the Group’s principal contractual financial obligations is shown below.
Further details on the items included can be found in the notes to the consolidated
financial statements. Details of the Group’s contingent liabilities are included in note
33 to the consolidated financial statements.
Payments due by period £m
1-3 3-5
Contractual obligations(1) Total <1 year years years >5 years
Borrowings(2) 49,130 10,809 12,509 7,594 18,218
Operating lease
commitments(3) 5,616 1,041 1,451 989 2,135
Capital
commitments(3)(4) 2,107 1,874 153 69 11
Purchase
commitments 2,518 1,616 524 283 95
Total contractual
cash obligations(1) 59,371 15,340 14,637 8,935 20,459
Notes:
(1) The above table of contractual obligations excludes commitments in respect of options over
interests in Group businesses held by minority shareholders (see “Option agreements and
similar arrangements”) and obligations to pay dividends to minority shareholders (see “Dividends
from associated undertakings and to minority shareholders”). The table excludes current and
deferred tax liabilities and obligations under post employment benefit schemes, details of which
are provided in notes 6 and 26 to the consolidated financial statements, respectively.
(2) See note 25 to the consolidated financial statements.
(3) See note 32 to the consolidated financial statements.
(4) Primarily related to network infrastructure.
Equity dividends
The table below sets out the amounts of interim, final and total cash dividends paid
or, in the case of the final dividend for the 2009 financial year, proposed, in respect of
each financial year.
Pence per ordinary share
Year ended 31 March Interim Final Total
2005 1.91 2.16 4.07
2006 2.20 3.87 6.07
2007 2.35 4.41 6.76
2008 2.49 5.02 7.51
2009 2.57 5.20(1) 7.77
Note:
(1) The final dividend for the year ended 31 March 2009 was proposed on 19 May 2009 and is
payable on 7 August 2009 to holders of record as of 5 June 2009. For American Depositary
Share (‘ADS’) holders, the dividend will be payable in US dollars under the terms of the ADS
depositary agreement.
Liquidity and capital resources
Cash ows
Financial position and resources