Vodafone 2009 Annual Report Download - page 37
Download and view the complete annual report
Please find page 37 of the 2009 Vodafone annual report below. You can navigate through the pages in the report by either clicking on the pages listed below, or by using the keyword search tool below to find specific information within the annual report.-
 1
1 -
2
-
3
-
4
-
5
-
6
-
7
-
8
-
9
-
10
-
11
-
12
-
13
-
14
-
15
-
16
-
17
-
18
-
19
-
20
-
21
-
22
-
23
-
24
-
25
-
26
-
 27
27 -
 28
28 -
 29
29 -
 30
30 -
 31
31 -
 32
32 -
 33
33 -
 34
34 -
 35
35 -
 36
36 -
 37
37 -
 38
38 -
 39
39 -
 40
40 -
 41
41 -
 42
42 -
 43
43 -
 44
44 -
 45
45 -
 46
46 -
 47
47 -
48
-
49
-
50
-
51
-
52
-
53
-
54
-
55
-
56
-
57
-
58
-
59
-
60
-
61
-
62
-
63
-
64
-
65
-
66
-
67
-
68
-
69
-
70
-
71
-
72
-
73
-
74
-
75
-
76
-
77
-
78
-
79
-
80
-
81
-
82
-
83
-
84
-
85
-
86
-
87
-
88
-
89
-
90
-
91
-
92
-
93
-
94
-
95
-
96
-
97
-
98
-
99
-
100
-
101
-
102
-
103
-
104
-
105
-
106
-
107
-
108
-
109
-
110
-
111
-
112
-
113
-
114
-
115
-
116
-
117
-
118
-
119
-
120
-
121
-
122
-
123
-
124
-
125
-
126
-
127
-
128
-
129
-
130
-
131
-
132
-
133
-
134
-
135
-
136
-
137
-
138
-
139
-
140
-
141
-
142
-
143
-
144
-
145
-
146
-
147
-
148
 |
 |

Performance
Vodafone Group Plc Annual Report 2009 35
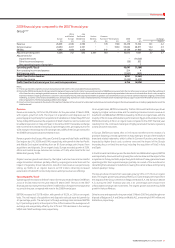
The impact of merger and acquisition activity and foreign exchange movements on
revenue, service revenue, EBITDA and adjusted operating profit are shown below:
Organic M&A Foreign Reported
growth activity exchange growth
% pps pps %
Revenue
Africa and Central Europe 13.6 6.0 1.2 20.8
Service revenue
Vodacom 16.5 – (7.9) 8.6
Other 11.2 9.5 6.6 27.3
Africa and Central Europe 13.2 6.2 1.6 21.0
EBITDA
Vodacom 18.3 – (7.9) 10.4
Other 13.9 3.6 3.6 21.1
Africa and Central Europe 15.6 2.1 (0.6) 17.1
Adjusted operating profit
Vodacom 19.1 – (7.5) 11.6
Other 17.0 52.7 (7.1) 62.6
Africa and Central Europe 18.0 22.6 (7. 5) 33.1
On an organic basis, voice revenue grew by 12.0% and messaging revenue and data
revenue rose by 6.6% and 103.9%, respectively, as a result of the 22.4% organic
increase in the average customer base.
Vodacom
Vodacom’s service revenue increased by 8.6%, or 16.5% at constant exchange rates,
which was a chieved largely th rough ave rag e customer grow th of 23 .1% . The customer
base was impacted by a change in the prepaid disconnection policy, which resulted
in 1.45 million disconnections in S eptember 20 07 a nd a hig her ongoing discon nection
rate. Vodacom’s data revenue growth remained very strong, driven by a rapid rise in
mobile PC connectivity devices.
Vodacom’s EBITDA rose by 10.4%, or 18.3% at constant exchange rates. The main
cost drivers were operating expenses, which increased by 19.3% at constant
exchange rates, and direct costs which grew by 17.1% at constant exchange rates,
primarily as a result of increased prepaid airtime commission following the growth
of the business. Growth at constant exchange rates was in excess of reported
growth as Vodacom’s reported performance in the 2008 financial year was
impacted by the negative effect of exchange rates arising on the translation of its
results into sterling.
Other Africa and Central Europe
Service revenue increased by 27.3%, by 11.2% on an organic basis, driven by
performances in Turkey and Romania.
At constant exchange rates, Turkey delivered revenue growth of 24%, assuming the
Group owned the business for the whole of both periods, with 25.2% growth in the
average customer base compared to the 2007 financial year. While growth rates
remained high, they slowed in the last quarter of the year, but remained consistent
with the overall growth rate for the market. In order to maintain momentum in an
increasingly competitive environment, the business concentrated on targeted
promotional offers and focused on developing distribution, as well as continued
investment in the brand and completing the planned improvements to network
coverage. The revenue performance year on year was principally as a result of
the increase in voice revenue driven by the rise in average customers, but also
benefited from the growth in messaging revenue, resulting from higher volumes.
In Romania, service revenue increased by 15.0%, or 19.6% at constant exchange
rates, driven by an 18.3% rise in the average customer base following the impact
of initiatives focusing on business and contract customers, as well as growth in
roaming revenue and a strong performance in data revenue following successful
promotions and a growing base of mobile data customers. However, service revenue
growth slowed in the last quarter, when compared to the same quarter in the 2007
financial year, in line with lower average customer growth, which was in turn driven
by increased competition in the market, with five mobile operators competing for
market share.
EBITDA grew by 21.1%, or by 13.9% on an organic basis, with the main drivers
of growth being Turkey and Romania.
Turkey generated strong growth in EBITDA, assuming the Group owned the business
for the whole of both periods, driven by the increase in revenue. The closing customer
base grew by 21.8% following additional investment in customer acquisition activities,
with the new connections in the year driving the higher customer costs. Direct costs
were up, mainly due to ongoing regulatory fees, which equate to 15% of revenue.
Operating expenses remained constant as a percentage of service revenue but
increased following continued investment in the brand and network in line with the
acquisition plan.
Romania’s EBITDA grew by 15.8%, or 20.9% at constant exchange rates, with increases
in costs being mitigated by ser vice revenue performance. Direct cos ts grew, reflecting
the 18.3% rise in the average customer base. As a percentage of service revenue,
customer costs increased as a result of the increased competition for customers.
Increases in the number of direct sales and distribution employees, following the
market trend towards direct distribution channels, led to a 6.6% increase in operating
expenses, or 11.0% at constant exchange rates.
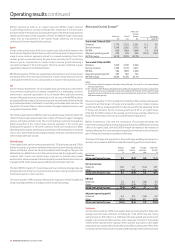
Asia Pacic and Middle East(1)
Asia Pacific
and Middle
India Other East % change
£m £m £m £ Organic
Year ended 31 March 2008
Revenue 1,822 2,577 4,399 87.4 15.9
Service revenue 1,753 2,348 4,101 90.4 16.2
EBITDA 598 878 1,476 78.7 14.3
Adjusted operating profit 35 495 530 12.3 8.1
EBITDA margin 32. 8% 34.1% 33.6%
Year ended 31 March 2007
Revenue – 2,347 2,347
Service revenue – 2,154 2 ,154
EBITDA – 826 826
Adjusted operating profit – 472 472
EBITDA margin – 35.2% 35.2%
Note:
(1) The Group revised its segment structure during the year. See note 3 to the consolidated
financial statements.
Vodafone continued to execute on its strategy to deliver strong growth in emerging
markets during the 2008 financial year, with the acquisition of Vodafone Essar
(formerly Hutchison Essar) in India and with strong performance in Egypt. The Group
began to differentiate itself in emerging markets, with initiatives such as the
introduction of Vodafone branded handsets.
On 8 May 2007, the Group continued to successfully increase it s portfolio in emerging
markets by acquiring companies with interests in Vodafone Essar, a leading operator
in the fast growing Indian mobile market, following which the Group controls
Vodafone Essar. The business was rebranded to Vodafone in September 2007.
In conjunction with the Vodafone Essar acquisition, the Group signed a memorandum
of understanding with Bharti Airtel, the Group’s former joint venture in India, on
infrastructure sharing and granted an option to a Bharti group company to buy its
5.60% direct interest in Bharti Airtel, which was exercised on 9 May 2007.
Revenue growth for the year ended 31 March 2008 was 87.4% for the region, or 15.9%
on an organic basis, with the key driver for organic growth being the increase in
service revenue of 90.4%, or 16.2% on an organic basis.
EBITDA increased by 78.7% for the year ended 31 March 2008, or 14.3% on an organic
basis, due to performances in Egypt and Australia.