Vodafone 2009 Annual Report Download - page 76
Download and view the complete annual report
Please find page 76 of the 2009 Vodafone annual report below. You can navigate through the pages in the report by either clicking on the pages listed below, or by using the keyword search tool below to find specific information within the annual report.-
 1
1 -
2
-
3
-
4
-
5
-
6
-
7
-
8
-
9
-
10
-
11
-
12
-
13
-
14
-
15
-
16
-
17
-
18
-
19
-
20
-
21
-
22
-
23
-
24
-
25
-
26
-
27
-
28
-
29
-
30
-
31
-
32
-
33
-
34
-
35
-
36
-
37
-
38
-
39
-
40
-
41
-
42
-
43
-
44
-
45
-
46
-
47
-
48
-
49
-
50
-
51
-
52
-
53
-
54
-
55
-
56
-
57
-
58
-
59
-
60
-
61
-
62
-
63
-
64
-
65
-
 66
66 -
 67
67 -
 68
68 -
 69
69 -
 70
70 -
 71
71 -
 72
72 -
 73
73 -
 74
74 -
 75
75 -
 76
76 -
 77
77 -
 78
78 -
 79
79 -
 80
80 -
 81
81 -
 82
82 -
 83
83 -
 84
84 -
 85
85 -
 86
86 -
87
-
88
-
89
-
90
-
91
-
92
-
93
-
94
-
95
-
96
-
97
-
98
-
99
-
100
-
101
-
102
-
103
-
104
-
105
-
106
-
107
-
108
-
109
-
110
-
111
-
112
-
113
-
114
-
115
-
116
-
117
-
118
-
119
-
120
-
121
-
122
-
123
-
124
-
125
-
126
-
127
-
128
-
129
-
130
-
131
-
132
-
133
-
134
-
135
-
136
-
137
-
138
-
139
-
140
-
141
-
142
-
143
-
144
-
145
-
146
-
147
-
148
 |
 |

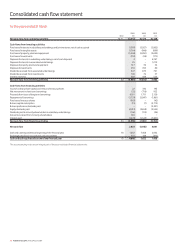
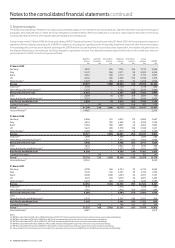
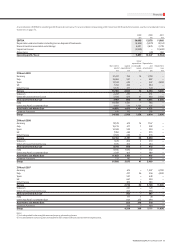
74 Vodafone Group Plc Annual Report 2009
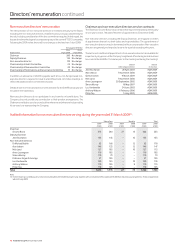
Restated
2009 2008 2007
Note £m £m £m
Revenue 3 41,017 35,478 31,104
Cost of sales (25,842) (21,890) (18,725)
Gross profit 15,175 13,588 12,379
Selling and distribution expenses (2,738) (2,511) (2,136)
Administrative expenses (4,771) (3,878) (3,437)
Share of result in associated undertakings 14 4,091 2,876 2,728
Impairment losses 10 (5,900) – (11,600)
Other income and expense 30 – (28) 502
Operating profit/(loss) 4 5,857 10,047 (1,564)
Non-operating income and expense 30 (44) 254 4
Investment income 5 795 714 789
Financing costs 5 (2,419) (2,014) (1,612)
Profit/(loss) before taxation 4,189 9,001 (2,383)
Income tax expense 6 (1,109) (2,245) (2,423)
Profit/(loss) for the financial year from continuing operations 3,080 6,756 (4,806)
Loss for the financial year from discontinued operations 30 – – (416)
Profit/(loss) for the financial year 3,080 6,756 (5,222)
Attributable to:
– Equity shareholders 23 3,078 6,660 (5,351)
– Minority interests 2 96 129
3,080 6,756 (5,222)
Basic earnings/(loss) per share
Profit/(loss) from continuing operations 8 5.84p 12.56p (8.94)p
Loss from discontinued operations 8, 30 – – (0.76)p
Profit/(loss) for the financial year 8 5.84p 12.56p (9.70)p
Diluted earnings/(loss) per share
Profit/(loss) from continuing operations 8 5.81p 12.50p (8.94)p
Loss from discontinued operations 8, 30 – – (0.76)p
Profit/(loss) for the financial year 8 5.81p 12.50p (9.70)p
for the years ended 31 March
for the years ended 31 March
Restated
2009 2008 2007
Note £m £m £m
(Losses)/gains on revaluation of available-for-sale investments, net of tax 22 (2,383) 1,949 2,108
Exchange differences on translation of foreign operations, net of tax 22 12,375 5,537 (3,804)
Net actuarial (losses)/gains on defined benefit pension schemes, net of tax 22 (163) (37) 50
Revaluation gain 22 68 – –
Foreign exchange (gains)/losses transferred to the consolidated income statement 22 (3) (7) 763
Fair value gains transferred to the consolidated income statement 22 – (570) –
Other, net of tax 22 (40) 37 –
Net gain/(loss) recognised directly in equity 9,854 6,909 (883)
Profit/(loss) for the financial year 3,080 6,756 (5,222)
Total recognised income and expense relating to the year 12,934 13,665 (6,105)
Attributable to:
– Equity shareholders 13,037 13,912 (6,210)
– Minority interests (103) (247) 105
12,934 13,665 (6,105)
The accompanying notes are an integral part of these consolidated financial statements.
Consolidated statement of recognised income and expense
Consolidated income statement