Vodafone 2004 Annual Report Download - page 96
Download and view the complete annual report
Please find page 96 of the 2004 Vodafone annual report below. You can navigate through the pages in the report by either clicking on the pages listed below, or by using the keyword search tool below to find specific information within the annual report.-
 1
1 -
2
-
3
-
4
-
5
-
6
-
7
-
8
-
9
-
10
-
11
-
12
-
13
-
14
-
15
-
16
-
17
-
18
-
19
-
20
-
21
-
22
-
23
-
24
-
25
-
26
-
27
-
28
-
29
-
30
-
31
-
32
-
33
-
34
-
35
-
36
-
37
-
38
-
39
-
40
-
41
-
42
-
43
-
44
-
45
-
46
-
47
-
48
-
49
-
50
-
51
-
52
-
53
-
54
-
55
-
56
-
57
-
58
-
59
-
60
-
61
-
62
-
63
-
64
-
65
-
66
-
67
-
68
-
69
-
70
-
71
-
72
-
73
-
74
-
75
-
76
-
77
-
78
-
79
-
80
-
81
-
82
-
83
-
84
-
85
-
 86
86 -
 87
87 -
 88
88 -
 89
89 -
 90
90 -
 91
91 -
 92
92 -
 93
93 -
 94
94 -
 95
95 -
 96
96 -
 97
97 -
 98
98 -
 99
99 -
 100
100 -
 101
101 -
 102
102 -
 103
103 -
 104
104 -
 105
105 -
 106
106 -
107
-
108
-
109
-
110
-
111
-
112
-
113
-
114
-
115
-
116
-
117
-
118
-
119
-
120
-
121
-
122
-
123
-
124
-
125
-
126
-
127
-
128
-
129
-
130
-
131
-
132
-
133
-
134
-
135
-
136
-
137
-
138
-
139
-
140
-
141
-
142
 |
 |

Vodafone Group Plc Annual Report 2004
94
Notes to the Consolidated Financial Statements continued
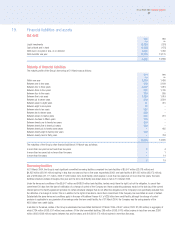
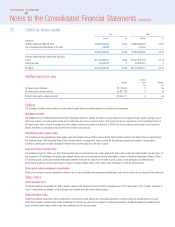
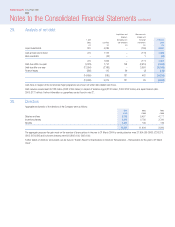
20. Financial instruments
Fair values of financial assets and liabilities
The carrying amounts and estimated fair value of the Group’s outstanding financial instruments are set out below:
2004 2004 2003 2003
Net carrying Estimated Net carrying Estimated
amount fair value amount fair value
£m £m £m £m
Fixed asset investments (excluding investments in joint ventures and
associated undertakings)(1) 1,049 1,290 1,164 1,027
Cash at bank and in hand 1,409 1,409 475 475
Liquid investments 4,381 4,381 291 291
Borrowings:
Short term 1,974 2,034 1,356 1,371
Long term 12,224 13,029 13,175 14,173
Derivative financial instruments:
Interest rate – 343 – 683
Foreign exchange (80) (80) (74) (74)
Note:
(1) Restated as a result of the adoption of UITF 38 “Accounting for ESOP Trusts”.
The Group’s exposure to market risk, which is the sensitivity of the value of financial instruments to changes in related currency and interest rates, is minimised
because gains and losses on the underlying assets and liabilities offset gains and losses on derivative financial instruments. The following methods and
assumptions were used to estimate the fair values shown above.
Fixed asset investments (excluding investments in joint ventures and associated undertakings) – The net book value of fixed asset investments at
31 March 2004 comprises investments recorded at an original cost of £2,079 million (2003: £2,568 million). Listed investments are stated at fair value based
on their quoted share price at 31 March 2004.
Cash at bank and in hand and liquid investments – The carrying values of cash and liquid investments approximate to their fair values because of the
short term maturity of these instruments.
Borrowings (excluding foreign exchange contracts) – The fair value of quoted long term borrowings is based on year end mid-market quoted prices. The book
values stated above excludes accrued interest on borrowings which is recorded separately on the balance sheet within accruals and deferred income. The fair
value of other borrowings is estimated by discounting the future cash flows to net present values using appropriate market interest and foreign currency rates
prevailing at the year end.
Foreign exchange contracts, interest rate swaps and futures – The Group enters into foreign exchange contracts, interest rate swaps and futures in order
to manage its foreign currency and interest rate exposure. The book values stated above exclude accrued interest which is recorded separately in the balance
sheet. The fair value of these financial instruments was estimated by discounting the future cash flows to net present values using appropriate market interest
and foreign currency rates prevailing at the year end.
Hedges
The Group’s policy is to use derivative instruments to hedge against exposure to movements in interest rates and exchange rates. Changes in the fair value of
instruments used for hedging are not recognised in the financial statements until the hedged exposure is itself recognised. Unrecognised gains and losses on
instruments used for hedging are set out below: Total net
Gains Losses gains/(losses)
£m £m £m
Unrecognised gains and losses on hedges at 1 April 2003 721 (39) 682
Less: gains and losses arising in previous years that were recognised in the year (211) 18 (193)
Gains and losses arising before 1 April 2003 that were not recognised at 31 March 2004 510 (21) 489
Gains and losses arising in the year that were not recognised at 31 March 2004 (87) (59) (146)
Unrecognised gains and losses on hedges at 31 March 2004 423 (80) 343
Of which:
Gains and losses expected to be recognised in the year ending 31 March 2005 91 (23) 68
In addition to the amounts disclosed above, cumulative aggregate gains of £607 million in respect of terminated interest rate swaps were carried forward in the
balance sheet as at 31 March 2004 pending their recognition in the profit and loss account (2003: £415 million). Of these carried forward amounts, gains of
£155 million are expected to be recognised in the profit and loss account in the 2005 financial year. Aggregate related gains of £90 million from previous years
were recognised in the profit and loss account in the 2004 financial year (2003: £53 million).
Currency exposures
Taking into account the effect of forward contracts and other derivative instruments, the Group did not have any material financial exposure to foreign exchange
gains or losses on monetary assets and monetary liabilities denominated in foreign currencies at 31 March 2004.