Vodafone 2004 Annual Report Download - page 10
Download and view the complete annual report
Please find page 10 of the 2004 Vodafone annual report below. You can navigate through the pages in the report by either clicking on the pages listed below, or by using the keyword search tool below to find specific information within the annual report.-
 1
1 -
 2
2 -
 3
3 -
 4
4 -
 5
5 -
 6
6 -
 7
7 -
 8
8 -
 9
9 -
 10
10 -
 11
11 -
 12
12 -
 13
13 -
 14
14 -
 15
15 -
 16
16 -
 17
17 -
 18
18 -
 19
19 -
 20
20 -
 21
21 -
22
-
23
-
24
-
25
-
26
-
27
-
28
-
29
-
30
-
31
-
32
-
33
-
34
-
35
-
36
-
37
-
38
-
39
-
40
-
41
-
42
-
43
-
44
-
45
-
46
-
47
-
48
-
49
-
50
-
51
-
52
-
53
-
54
-
55
-
56
-
57
-
58
-
59
-
60
-
61
-
62
-
63
-
64
-
65
-
66
-
67
-
68
-
69
-
70
-
71
-
72
-
73
-
74
-
75
-
76
-
77
-
78
-
79
-
80
-
81
-
82
-
83
-
84
-
85
-
86
-
87
-
88
-
89
-
90
-
91
-
92
-
93
-
94
-
95
-
96
-
97
-
98
-
99
-
100
-
101
-
102
-
103
-
104
-
105
-
106
-
107
-
108
-
109
-
110
-
111
-
112
-
113
-
114
-
115
-
116
-
117
-
118
-
119
-
120
-
121
-
122
-
123
-
124
-
125
-
126
-
127
-
128
-
129
-
130
-
131
-
132
-
133
-
134
-
135
-
136
-
137
-
138
-
139
-
140
-
141
-
142
 |
 |

Vodafone Group Plc Annual Report 2004
8
Business Overview continued
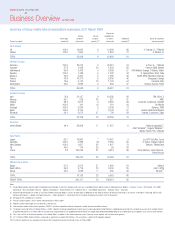
Summary of Group mobile telecommunications businesses at 31 March 2004
Registered
Venture Venture proportionate
Percentage customers(3) customer customers Registered Names of competitor
Country by region(1) ownership(2) (thousands) growth (%)(4) (thousands) prepaid (%)(5) network operators(6)
UK & Ireland
UK 100.0 14,095 6 14,095 60 3, Orange, O2, T-Mobile
Ireland 100.0 1,864 7 1,864 72 3, Meteor, O2
TOTAL 15,959 6 15,959 61
Northern Europe
Germany 100.0 25,012 9 25,012 51 E-Plus, O2, T-Mobile
Hungary 87.9 1,428 50 1,255 82 Pannon GSM, Westel
Netherlands 99.9 3,403 4 3,399 57 KPN Mobile, Orange, T-Mobile, Telfort
Sweden 100.0 1,438 9 1,438 34 3, SpringMobil, Tele2, Telia
Belgium 25.0 4,351 2 1,088 59 BASE (KPN), Mobistar (Orange)
France 43.9 14,370 8 6,309 46 Bouygues, Orange
Poland 19.6 5,740 19 1,126 54 Centertel, ERA
Switzerland 25.0 3,838 6 960 37 Orange, Sunrise, Tele2
TOTAL 59,580 9 40,587 51
Southern Europe
Italy 76.8 21,137 9 16,232 92 TIM, Wind, 3
Albania 99.7 528 35 527 97 AMC
Greece 99.4 3,678 9 3,655 68 Cosmote, Q-Telecom, Telestet
Malta 100.0 161 (1) 161 91 Go Mobile
Portugal 100.0 3,248 5 3,248 72 Optimus, TMN
Spain 100.0 9,705 7 9,705 57 Amena, Telefónica Móviles
Romania 20.1 3,672 37 738 63 Orange, Cosmorom, Zapp
TOTAL 42,129 10 34,266 78
Americas
United States(7) 44.4 38,909 17 17,257 6 National operators(8):
AT&T Wireless(9), Cingular Wireless(9),
Nextel, Sprint PCS, T-Mobile
Asia Pacific
Japan 69.7 14,951 7 10,427 9 au, NTT DoCoMo, Tu-ka
Australia 100.0 2,486 (3) 2,486 55 3, Optus, Orange, Telstra
New Zealand 100.0 1,607 25 1,607 79 Telecom, TelstraClear
Fiji 49.0 114 25 56 92 –
China 3.3 150,256 21 4,913 66 China Netcom, China Telecom,
China Unicom
TOTAL 169,414 20 19,489 61
Middle East & Africa
Egypt 67.0 2,872 27 1,924 81 Mobinil
South Africa 35.0 9,725 24 3,404 85 Cell C, MTN
Kenya 35.0 1,529 77 535 99 Kencell(10)
TOTAL 14,126 28 5,863 86
GROUP TOTAL 340,117 15 133,421 56
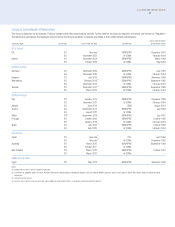
Notes:
(1) All controlled networks operate under the Vodafone brand. Networks in which the Company does not have a controlling interest operate under the following brands: Belgium – Proximus; France – SFR; Poland – Plus GSM;
Switzerland – Swisscom Mobile; Romania – Mobifon; United States – Verizon Wireless; Fiji – Vodafone; China – China Mobile; South Africa – Vodacom; Kenya – Safaricom.
(2) All ownership percentages are stated as at 31 March 2004 and exclude options, warrants or other rights or obligations of the Group to increase or decrease ownership in any venture as detailed in “Operating and Financial
Review and Prospects – Liquidity and Capital Resources – Option agreements”. Ownership interests have been rounded to the nearest tenth of one percent.
(3) See page 23 for a definition of a customer.
(4) Venture customer growth is for the twelve month period to 31 March 2004.
(5) Prepaid customer percentages are calculated on a venture basis.
(6) Table excludes mobile virtual network operators (“MVNOs”) and other competitors who do not operate a mobile telecommunications network.
(7) The Group’s ownership interest in Verizon Wireless is 45.0%. However, the Group’s proportionate customer base has been adjusted for Verizon Wireless’s proportionate ownership of its customer base across all its network interests
of approximately 98.6% at 31 March 2004. In the absence of acquired interests, this proportionate ownership will vary slightly from period to period depending on the underlying mix of net additions across each of these networks.
(8) This is not a full list of US network operators. In the United States, in addition to the national operators shown, there are several regional and numerous local operators.
(9) On 17 February 2004, Cingular Wireless announced an agreement to acquire AT&T Wireless. This acquisition is subject to US regulatory approval.
(10) The Kenyan Government has awarded a third licence but the operator had not commenced service at 25 May 2004.