Vodafone 2004 Annual Report Download - page 95
Download and view the complete annual report
Please find page 95 of the 2004 Vodafone annual report below. You can navigate through the pages in the report by either clicking on the pages listed below, or by using the keyword search tool below to find specific information within the annual report.-
 1
1 -
2
-
3
-
4
-
5
-
6
-
7
-
8
-
9
-
10
-
11
-
12
-
13
-
14
-
15
-
16
-
17
-
18
-
19
-
20
-
21
-
22
-
23
-
24
-
25
-
26
-
27
-
28
-
29
-
30
-
31
-
32
-
33
-
34
-
35
-
36
-
37
-
38
-
39
-
40
-
41
-
42
-
43
-
44
-
45
-
46
-
47
-
48
-
49
-
50
-
51
-
52
-
53
-
54
-
55
-
56
-
57
-
58
-
59
-
60
-
61
-
62
-
63
-
64
-
65
-
66
-
67
-
68
-
69
-
70
-
71
-
72
-
73
-
74
-
75
-
76
-
77
-
78
-
79
-
80
-
81
-
82
-
83
-
84
-
 85
85 -
 86
86 -
 87
87 -
 88
88 -
 89
89 -
 90
90 -
 91
91 -
 92
92 -
 93
93 -
 94
94 -
 95
95 -
 96
96 -
 97
97 -
 98
98 -
 99
99 -
 100
100 -
 101
101 -
 102
102 -
 103
103 -
 104
104 -
 105
105 -
106
-
107
-
108
-
109
-
110
-
111
-
112
-
113
-
114
-
115
-
116
-
117
-
118
-
119
-
120
-
121
-
122
-
123
-
124
-
125
-
126
-
127
-
128
-
129
-
130
-
131
-
132
-
133
-
134
-
135
-
136
-
137
-
138
-
139
-
140
-
141
-
142
 |
 |

Annual Report 2004 Vodafone Group Plc
93
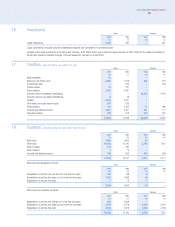
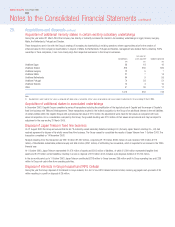
Financial assets
Non-interest bearing assets
Other
Floating Fixed non-interest
rate rate bearing
financial financial Equity financial
Total assets(1) assets investments(2) assets
Currency £m £m £m £m £m
At 31 March 2004:
Sterling 268 264 – 4 –
Euro 2,299 2,245 – 945
US dollar 3,231 3,219 – 39
Japanese yen 242 4 – 144 94
Other 912 95 – 809 8
Gross financial assets 6,952 5,827 – 969 156
At 31 March 2003 as restated:
Sterling 19 17 – 2 –
Euro 636 528 – 49 59
US dollar 50 29 – 318
Japanese yen 240 71 – 134 35
Other 1,068 121 – 940 7
Gross financial assets 2,013 766 – 1,128 119
Financial assets comprise
2004 2003
£m £m
Cash at bank and in hand 1,409 475
Liquid investments 4,381 291
Current asset investments ––
Trade and other debtors due after more than one year 113 83
Fixed asset investments (other than joint ventures and associated undertakings)(2) (3) 1,049 1,164
6,952 2,013
Notes:
(1) Floating rate financial assets comprise cash and short-term deposits of £3,802 million (2003: £761 million) and US dollar denominated commercial paper totalling £2,025 million (2003: euro
denominated commercial paper totalling £5 million), invested with counterparties having a single-A credit rating or above from at least two of Moody’s, Fitch Ratings and Standard & Poor’s. These
ratings are used in determining the daily settlement and aggregate credit risk with each counterparty.
(2) Equity investments include £810 million (2003: £1,100 million) represented by listed investments. Listed equity investments denominated in currencies other than sterling include £809 million (2003:
£939 million) denominated in Hong Kong dollars and £1 million (2003: £86 million) denominated in Japanese yen.
(3) Restated as a result of the adoption of UITF 38 “Accounting for ESOP Trusts”.