Vodafone 2004 Annual Report Download - page 123
Download and view the complete annual report
Please find page 123 of the 2004 Vodafone annual report below. You can navigate through the pages in the report by either clicking on the pages listed below, or by using the keyword search tool below to find specific information within the annual report.-
 1
1 -
2
-
3
-
4
-
5
-
6
-
7
-
8
-
9
-
10
-
11
-
12
-
13
-
14
-
15
-
16
-
17
-
18
-
19
-
20
-
21
-
22
-
23
-
24
-
25
-
26
-
27
-
28
-
29
-
30
-
31
-
32
-
33
-
34
-
35
-
36
-
37
-
38
-
39
-
40
-
41
-
42
-
43
-
44
-
45
-
46
-
47
-
48
-
49
-
50
-
51
-
52
-
53
-
54
-
55
-
56
-
57
-
58
-
59
-
60
-
61
-
62
-
63
-
64
-
65
-
66
-
67
-
68
-
69
-
70
-
71
-
72
-
73
-
74
-
75
-
76
-
77
-
78
-
79
-
80
-
81
-
82
-
83
-
84
-
85
-
86
-
87
-
88
-
89
-
90
-
91
-
92
-
93
-
94
-
95
-
96
-
97
-
98
-
99
-
100
-
101
-
102
-
103
-
104
-
105
-
106
-
107
-
108
-
109
-
110
-
111
-
112
-
 113
113 -
 114
114 -
 115
115 -
 116
116 -
 117
117 -
 118
118 -
 119
119 -
 120
120 -
 121
121 -
 122
122 -
 123
123 -
 124
124 -
 125
125 -
 126
126 -
 127
127 -
 128
128 -
 129
129 -
 130
130 -
 131
131 -
 132
132 -
 133
133 -
134
-
135
-
136
-
137
-
138
-
139
-
140
-
141
-
142
 |
 |

Annual Report 2004 Vodafone Group Plc
121
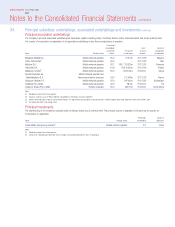
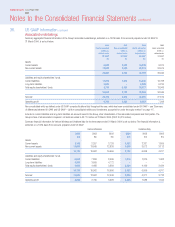
Finite-lived intangible assets
2004 2003
Gross carrying Accumulated Gross carrying Accumulated
amount amortisation amount amortisation
£m £m £m £m
Licences 159,482 48,012 164,873 34,717
Customer bases 7,417 4,939 6,942 3,634
166,899 52,951 171,815 38,351
Further analysis as to how amounts presented within the US GAAP reconciliation for goodwill and other intangibles, net of amortisation have been determined is
provided below.
2004 2003
£m £m
Use of a different measurement date for the purposes of determining purchase consideration 2,630 3,542
Deferred tax 42,188 46,960
Other 502 642
45,320 51,144
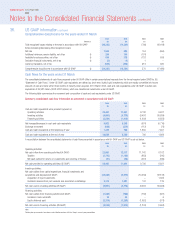
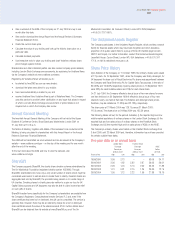
The total amortisation charge for the year ended 31 March 2004, under US GAAP, was £15,893 million (2003: £13,873 million). The estimated future
amortisation charge on finite-lived intangible assets for each of the next five years is set out in the following table. The estimate is based on finite-lived
intangible assets recognised at 31 March 2004 using foreign exchange rates on that date. It is likely that future amortisation charges will vary from the figures
below, as the estimate does not include the impact of any future investments, disposals, capital expenditures or fluctuations in foreign exchange rates.
Year ending 31 March £m
2005 16,054
2006 15,194
2007 14,918
2008 14,794
2009 14,708
The following pro forma information presents the impact of results under US GAAP, had the Group accounted for its goodwill and identifiable intangible assets
under SFAS No. 142 for all years presented after giving effect to such reclassifications for all years presented.
2004 2003 2002
£m £m £m
Reported net loss (8,127) (9,055) (16,688)
Amortisation of licences with indefinite lives, net of income taxes –– 704
Pro forma net loss (8,127) (9,055) (15,984)
Reported basic and diluted loss per share (11.93)p (13.29)p (24.56)p
Amortisation of licences with indefinite lives, net of income taxes ––1.04p
Pro forma basic and diluted net loss per share (11.93)p (13.29)p (23.52)p