Vodafone 2004 Annual Report Download - page 126
Download and view the complete annual report
Please find page 126 of the 2004 Vodafone annual report below. You can navigate through the pages in the report by either clicking on the pages listed below, or by using the keyword search tool below to find specific information within the annual report.-
 1
1 -
2
-
3
-
4
-
5
-
6
-
7
-
8
-
9
-
10
-
11
-
12
-
13
-
14
-
15
-
16
-
17
-
18
-
19
-
20
-
21
-
22
-
23
-
24
-
25
-
26
-
27
-
28
-
29
-
30
-
31
-
32
-
33
-
34
-
35
-
36
-
37
-
38
-
39
-
40
-
41
-
42
-
43
-
44
-
45
-
46
-
47
-
48
-
49
-
50
-
51
-
52
-
53
-
54
-
55
-
56
-
57
-
58
-
59
-
60
-
61
-
62
-
63
-
64
-
65
-
66
-
67
-
68
-
69
-
70
-
71
-
72
-
73
-
74
-
75
-
76
-
77
-
78
-
79
-
80
-
81
-
82
-
83
-
84
-
85
-
86
-
87
-
88
-
89
-
90
-
91
-
92
-
93
-
94
-
95
-
96
-
97
-
98
-
99
-
100
-
101
-
102
-
103
-
104
-
105
-
106
-
107
-
108
-
109
-
110
-
111
-
112
-
113
-
114
-
115
-
 116
116 -
 117
117 -
 118
118 -
 119
119 -
 120
120 -
 121
121 -
 122
122 -
 123
123 -
 124
124 -
 125
125 -
 126
126 -
 127
127 -
 128
128 -
 129
129 -
 130
130 -
 131
131 -
 132
132 -
 133
133 -
 134
134 -
 135
135 -
 136
136 -
137
-
138
-
139
-
140
-
141
-
142
 |
 |

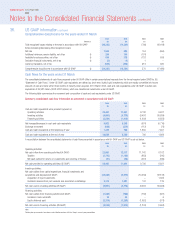
Had compensation cost been determined based upon the fair value of the share options and ADS options at grant date, the Group’s net loss and loss per share
would have been restated to the pro forma amounts indicated below (in millions, except per share amounts):
2004 2003 2002
£m £m £m
Net loss as reported under US GAAP (8,127) (9,055) (16,688)
Share-based employee compensation expense net of related tax effects, included in the
determination of net income as reported 129 48 –
Share-based employee compensation expense, under fair value based method
for all awards, net of related tax effects (107) (65) (81)
Pro forma net loss (8,105) (9,072) (16,769)
Loss per share
Basic and diluted – as reported under US GAAP (11.93)p (13.29)p (24.56)p
Basic and diluted – pro forma (11.90)p (13.31)p (24.67)p
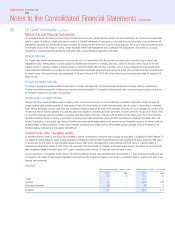
Pensions and other post retirement benefits
As at 31 March 2004, the Group operated a number of pension plans for the benefit of its employees throughout the world, which vary with conditions and
practices in the countries concerned. A description of the major pension plans provided is given in note 32.
Analyses of the net pension cost, plan assets, obligations and funded status for the major defined benefit plans in the UK, Germany and Japan, prepared under
US GAAP, are provided below.
The investment policy and strategy of the main scheme in the UK is set by the Trustees and reflects the liabilities of the plan. As at 31 March 2004, 79% (2003:
79%; 2002: 90%) of the assets are invested in equities and the remainder in bonds. The investment policy and strategy of the German plans are set by the
Investment Sub-Committee of the Contractual Trust Agreement and similarly reflects the liabilities of the plans, which are more heavily weighted towards
pensioners than the UK plan. 70% of the assets are invested in bonds and the remainder in equities.
The basis used to determine the overall long term return on plan assets is to apply the expected rate of return on bonds based on market interest rates at the
relevant date to that proportion of the assets invested in bonds. The bond rate of return is then increased by an allowance for the expected equity risk premium
in each market, based on past experience and future expectations of return and this rate is applied to the relevant proportion invested in equities. The
measurement date for the Group’s pension assets and obligations is 31 March. The measurement date for the Group’s net periodic pension cost is 1 April. The
cash contributions for the UK plan for the year ending 31 March 2005 are currently estimated to be £36 million.
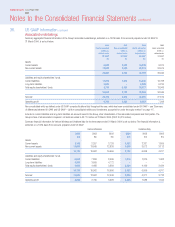
UK Germany Japan
2004 2003 2002 2004 2003 2002 2004 2003 2002
£m £m £m £m £m £m £m £m £m
Service cost 25 23 27 33210 12 5
Interest costs 19 16 11 777121
Expected return on assets (21) (23) (16) (4) (1) ––––
Amortisation of prior service cost –– 1 ––––––
Amortisation of gains and losses 16 9323111 –
Net periodic pension cost 39 25 26 812 10 12 15 6
Termination benefits and curtailment costs ––––––(16) 24 1
Accumulated benefit obligation 390 279 218 153 141 113 25 106 101
Change in projected benefit obligation
Benefit obligation at 1 April 327 258 184 145 119 114 127 115 97
Service cost 25 23 27 33210 12 4
Interest cost 19 16 11 777121
Members’ contributions 10 99––––––
Amendments ––––(3) 5 –523
Actuarial loss/(gain) 82 28 33 19 13 – (3) 4 –
Curtailment –––(2) –––2 –
Settlement ––––––(76) 13 –
Special termination benefit –––––––9 –
Benefits paid (estimated) (6) (7) (6) (9) (9) (8) (22) (36) (10)
Exchange movement –––(5) 15 (1) (2) 1 –
Benefit obligation at 31 March 457 327 258 158 145 119 35 127 115
Vodafone Group Plc Annual Report 2004
124
Notes to the Consolidated Financial Statements continued
36. US GAAP information continued