Vodafone 2004 Annual Report Download - page 112
Download and view the complete annual report
Please find page 112 of the 2004 Vodafone annual report below. You can navigate through the pages in the report by either clicking on the pages listed below, or by using the keyword search tool below to find specific information within the annual report.-
 1
1 -
2
-
3
-
4
-
5
-
6
-
7
-
8
-
9
-
10
-
11
-
12
-
13
-
14
-
15
-
16
-
17
-
18
-
19
-
20
-
21
-
22
-
23
-
24
-
25
-
26
-
27
-
28
-
29
-
30
-
31
-
32
-
33
-
34
-
35
-
36
-
37
-
38
-
39
-
40
-
41
-
42
-
43
-
44
-
45
-
46
-
47
-
48
-
49
-
50
-
51
-
52
-
53
-
54
-
55
-
56
-
57
-
58
-
59
-
60
-
61
-
62
-
63
-
64
-
65
-
66
-
67
-
68
-
69
-
70
-
71
-
72
-
73
-
74
-
75
-
76
-
77
-
78
-
79
-
80
-
81
-
82
-
83
-
84
-
85
-
86
-
87
-
88
-
89
-
90
-
91
-
92
-
93
-
94
-
95
-
96
-
97
-
98
-
99
-
100
-
101
-
 102
102 -
 103
103 -
 104
104 -
 105
105 -
 106
106 -
 107
107 -
 108
108 -
 109
109 -
 110
110 -
 111
111 -
 112
112 -
 113
113 -
 114
114 -
 115
115 -
 116
116 -
 117
117 -
 118
118 -
 119
119 -
 120
120 -
 121
121 -
 122
122 -
123
-
124
-
125
-
126
-
127
-
128
-
129
-
130
-
131
-
132
-
133
-
134
-
135
-
136
-
137
-
138
-
139
-
140
-
141
-
142
 |
 |

Vodafone Group Plc Annual Report 2004
110
Notes to the Consolidated Financial Statements continued
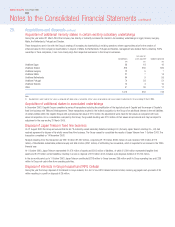
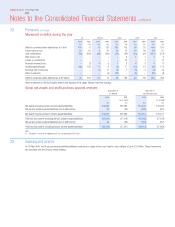
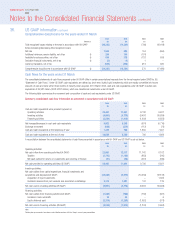
Movement in deficit during the year
UK Germany Japan Other Total
2004 2003 2004 2003 2004 2003 2004 2003 2004 2003
£m £m £m £m £m £m £m £m £m £m
Deficit in schemes before deferred tax at 1 April 119 72 73 131 126 115 88 52 406 370
Current service cost 32 24 821 10 12 44 40 94 97
Cash contributions (88) (106) (68) (100) (22) (36) (33) (31) (211) (273)
Past service cost –––––51116
Losses on curtailments –––––10 –1–11
Financial (income)/costs –(3) 491243911
Actuarial (gains)/losses (40) 132 11 5(6) 17 (12) 18 (47) 172
Exchange rate movements ––(1) 11 (3) 1(5) 4(9) 16
Other movements –––(4) (73) –(5) –(78) (4)
Deficit in schemes before deferred tax at 31 March 23 119 27 73 33 126 82 88 165 406
Other movements in 2004 principally relate to the disposal of the Japan Telecom fixed line business.
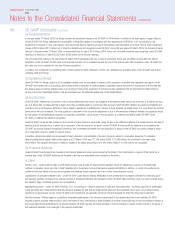
Group net assets and profit and loss account reserves
Under SSAP 24 Under FRS 17
(as adopted) (for information only)
2004 2003 2004 2003
(as restated)(1) (as restated)(1)
£m £m £m £m
Net assets excluding pension scheme assets/(liabilities) 114,836 131,528 114,836 131,528
Net pension scheme assets/(liabilities) (net of deferred tax) 95 (35) (103) (257)
Net assets including pension scheme assets/(liabilities) 114,931 131,493 114,733 131,271
Profit and loss reserve excluding pension scheme assets/(liabilities) (43,109) (27,412) (43,109) (27,412)
Net pension scheme assets/(liabilities) (net of deferred tax) 95 (35) (103) (257)
Profit and loss reserve including pension scheme assets/(liabilities) (43,014) (27,447) (43,212) (27,669)
Note:
(1) Restated as a result of the adoption of UITF 38 “Accounting for ESOP Trusts”.
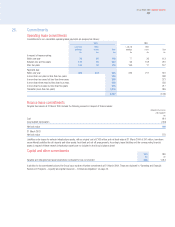
33. Subsequent events
On 25 May 2004, the Group announced potential additional investments in Japan which could result in cash outflows of up to £2.6 billion. These investments
are consistent with the Group’s overall strategy.
32. Pensions continued