Vodafone 2004 Annual Report Download - page 122
Download and view the complete annual report
Please find page 122 of the 2004 Vodafone annual report below. You can navigate through the pages in the report by either clicking on the pages listed below, or by using the keyword search tool below to find specific information within the annual report.-
 1
1 -
2
-
3
-
4
-
5
-
6
-
7
-
8
-
9
-
10
-
11
-
12
-
13
-
14
-
15
-
16
-
17
-
18
-
19
-
20
-
21
-
22
-
23
-
24
-
25
-
26
-
27
-
28
-
29
-
30
-
31
-
32
-
33
-
34
-
35
-
36
-
37
-
38
-
39
-
40
-
41
-
42
-
43
-
44
-
45
-
46
-
47
-
48
-
49
-
50
-
51
-
52
-
53
-
54
-
55
-
56
-
57
-
58
-
59
-
60
-
61
-
62
-
63
-
64
-
65
-
66
-
67
-
68
-
69
-
70
-
71
-
72
-
73
-
74
-
75
-
76
-
77
-
78
-
79
-
80
-
81
-
82
-
83
-
84
-
85
-
86
-
87
-
88
-
89
-
90
-
91
-
92
-
93
-
94
-
95
-
96
-
97
-
98
-
99
-
100
-
101
-
102
-
103
-
104
-
105
-
106
-
107
-
108
-
109
-
110
-
111
-
 112
112 -
 113
113 -
 114
114 -
 115
115 -
 116
116 -
 117
117 -
 118
118 -
 119
119 -
 120
120 -
 121
121 -
 122
122 -
 123
123 -
 124
124 -
 125
125 -
 126
126 -
 127
127 -
 128
128 -
 129
129 -
 130
130 -
 131
131 -
 132
132 -
133
-
134
-
135
-
136
-
137
-
138
-
139
-
140
-
141
-
142
 |
 |

Vodafone Group Plc Annual Report 2004
120
Notes to the Consolidated Financial Statements continued
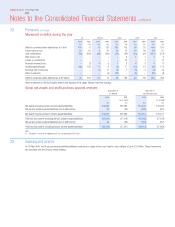
Market risk and financial instruments
The principal financial risks arising from the Group’s activities are funding risk, interest rate risk, currency risk and counterparty risk. The Group manages these
risks by a variety of methods, including the use of a number of financial instruments. All transactions in derivative financial instruments are undertaken for risk
management purposes only, by specialist treasury personnel. No instruments are held by the Group for trading purposes. The Group’s treasury function provides
a centralised service to the Group for funding, foreign exchange, interest rate management and counterparty risk management, with operations, including
transactions in derivative financial instruments, conducted within a policy framework approved by the Board.
Interest rate risk
The Group’s main interest rate exposures are to euro and yen, and, to a lesser extent US dollar and sterling interest rates. Under the Group’s interest rate
management policy, interest rates on monetary assets and liabilities are maintained on a floating rate basis, unless the forecast interest charge for the next
eighteen months is material in relation to forecast results, in which the interest rates are fixed. In addition, fixing may be undertaken for longer periods when
interest rates are statistically low. The term structure of interest rates is managed within limits approved by the Board, using derivative financial instruments such
as swaps, futures, options and forward rate agreements. At the end of the year, 20% (2003: 9%) of the Group’s gross borrowings were fixed for a period of at
least one year.
Foreign exchange rate risk
The Group’s geographical spread exposes it to fluctuations in foreign exchange rates. The Group manages its exposure to foreign currency movements by
hedging known future transactions, including those resulting from the repatriation of international dividends and loans. Foreign exchange forward contracts are
the derivative instrument most used for this purpose.
Investments in foreign entities
Although the Group reports its balance sheet in sterling, which is the principal currency for most transactions undertaken in its shares, it does not hedge its
foreign currency balance sheet exposure for three reasons. Firstly, the Group believes its shareholders principally value its shares by discounting its estimated
future sterling and foreign currency cash flows and converting to sterling at appropriate rates where necessary. Secondly, the Group manages the currency of its
net debt according to banded multiples of its operating cash flow, adjusted for dividends and share purchases, for those currencies. As such at 31 March 2004,
117% of net borrowings were denominated in currencies other than sterling (52% euro, 51% yen, 12% US dollar and 2% others) and 17% of net borrowings
had been purchased forward in sterling in anticipation of sterling denominated shareholder returns via share purchases and dividends. This allows debt to be
serviced in proportion to anticipated cash flows and therefore provides a partial hedge against profit and loss account translation exposure, as interest costs will
be denominated in foreign currencies. Thirdly, certain overseas businesses have foreign currency denominated goodwill allocated whilst other assets do not,
therefore making comparisons in the balance sheet difficult.
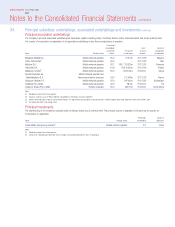
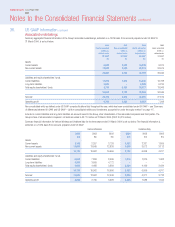
Goodwill and other intangible assets
As described further in note 25, the Group has undertaken a number of transactions during the year, including the acquisition of Singlepoint, Project Telecom Plc
and additional minority stakes in certain existing subsidiary undertakings. Under US GAAP, these transactions have resulted in the Group assigning £395 million
to goodwill and £1,578 million to other intangible assets, of which £996 million was assigned to mobile licences and £582 million to customer bases. A
corresponding deferred tax liability of £534 million was recognised. With the exception of goodwill, all intangible assets acquired are deemed to be of finite life,
with a weighted average amortisation period of 12 years, comprising mobile licences 18 years and customer bases 4 years.
Had the acquisitions of Singlepoint, Project Telecom Plc and the additional minority stake increases been consummated on 1 April of the year preceding the year
of acquisition, the results of these acquired operations would not have had a significant impact on the Group’s consolidated results of operations for each of the
financial years presented.
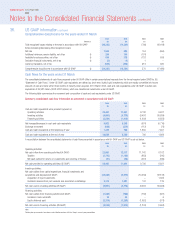
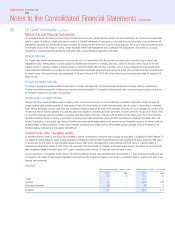
Goodwill
Mobile telecommunications – Northern Europe Mobile telecommunications – UK & Ireland
2004 2003 2004 2003
£m £m £m £m
1 April ––117 –
Additions 43 –352 108
Exchange movements (2) –(2) 9
31 March 41 –467 117
36. US GAAP information continued