Vodafone 2004 Annual Report Download - page 107
Download and view the complete annual report
Please find page 107 of the 2004 Vodafone annual report below. You can navigate through the pages in the report by either clicking on the pages listed below, or by using the keyword search tool below to find specific information within the annual report.-
 1
1 -
2
-
3
-
4
-
5
-
6
-
7
-
8
-
9
-
10
-
11
-
12
-
13
-
14
-
15
-
16
-
17
-
18
-
19
-
20
-
21
-
22
-
23
-
24
-
25
-
26
-
27
-
28
-
29
-
30
-
31
-
32
-
33
-
34
-
35
-
36
-
37
-
38
-
39
-
40
-
41
-
42
-
43
-
44
-
45
-
46
-
47
-
48
-
49
-
50
-
51
-
52
-
53
-
54
-
55
-
56
-
57
-
58
-
59
-
60
-
61
-
62
-
63
-
64
-
65
-
66
-
67
-
68
-
69
-
70
-
71
-
72
-
73
-
74
-
75
-
76
-
77
-
78
-
79
-
80
-
81
-
82
-
83
-
84
-
85
-
86
-
87
-
88
-
89
-
90
-
91
-
92
-
93
-
94
-
95
-
96
-
 97
97 -
 98
98 -
 99
99 -
 100
100 -
 101
101 -
 102
102 -
 103
103 -
 104
104 -
 105
105 -
 106
106 -
 107
107 -
 108
108 -
 109
109 -
 110
110 -
 111
111 -
 112
112 -
 113
113 -
 114
114 -
 115
115 -
 116
116 -
 117
117 -
118
-
119
-
120
-
121
-
122
-
123
-
124
-
125
-
126
-
127
-
128
-
129
-
130
-
131
-
132
-
133
-
134
-
135
-
136
-
137
-
138
-
139
-
140
-
141
-
142
 |
 |

Annual Report 2004 Vodafone Group Plc
105
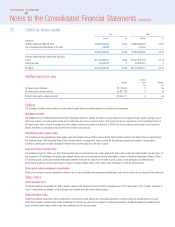
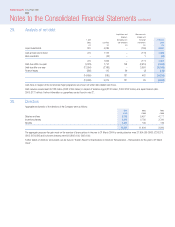
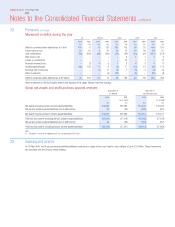
31. Employees
An analysis of the average number of employees by category of activity is shown below.
Of total average employees, 17% were based in the United Kingdom (2003: 15%, 2002: 16%).
2004 2003 2002
Number Number Number
By activity:
Operations 14,096 14,863 17,658
Selling and distribution 15,303 16,252 14,068
Administration 30,710 35,552 35,452
60,109 66,667 67,178
By segment:
Mobile Telecommunications:
UK & Ireland 12,636 11,323 10,829
Northern Europe 14,742 13,988 15,848
Southern Europe 17,573 17,251 16,986
Americas 241 391 471
Asia Pacific 6,048 7,063 6,007
Middle East and Africa 1,758 1,819 1,771
52,998 51,835 51,912
Other operations:
Europe 4,767 6,354 9,136
Asia Pacific 2,344 8,478 6,130
60,109 66,667 67,178
The cost incurred in respect of these employees (including directors) was:
2004 2003 2002
£m £m £m
Wages and salaries 2,018 1,984 1,740
Social security costs 234 199 192
Other pension costs 79 95 64
2,331 2,278 1,996