Vodafone 2004 Annual Report Download - page 92
Download and view the complete annual report
Please find page 92 of the 2004 Vodafone annual report below. You can navigate through the pages in the report by either clicking on the pages listed below, or by using the keyword search tool below to find specific information within the annual report.-
 1
1 -
2
-
3
-
4
-
5
-
6
-
7
-
8
-
9
-
10
-
11
-
12
-
13
-
14
-
15
-
16
-
17
-
18
-
19
-
20
-
21
-
22
-
23
-
24
-
25
-
26
-
27
-
28
-
29
-
30
-
31
-
32
-
33
-
34
-
35
-
36
-
37
-
38
-
39
-
40
-
41
-
42
-
43
-
44
-
45
-
46
-
47
-
48
-
49
-
50
-
51
-
52
-
53
-
54
-
55
-
56
-
57
-
58
-
59
-
60
-
61
-
62
-
63
-
64
-
65
-
66
-
67
-
68
-
69
-
70
-
71
-
72
-
73
-
74
-
75
-
76
-
77
-
78
-
79
-
80
-
81
-
 82
82 -
 83
83 -
 84
84 -
 85
85 -
 86
86 -
 87
87 -
 88
88 -
 89
89 -
 90
90 -
 91
91 -
 92
92 -
 93
93 -
 94
94 -
 95
95 -
 96
96 -
 97
97 -
 98
98 -
 99
99 -
 100
100 -
 101
101 -
 102
102 -
103
-
104
-
105
-
106
-
107
-
108
-
109
-
110
-
111
-
112
-
113
-
114
-
115
-
116
-
117
-
118
-
119
-
120
-
121
-
122
-
123
-
124
-
125
-
126
-
127
-
128
-
129
-
130
-
131
-
132
-
133
-
134
-
135
-
136
-
137
-
138
-
139
-
140
-
141
-
142
 |
 |
Vodafone Group Plc Annual Report 2004
90
Notes to the Consolidated Financial Statements continued
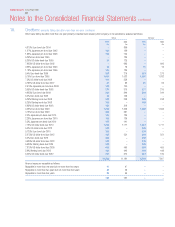
Other loans falling due after more than one year primarily comprise bond issues by the Company, or its subsidiaries, analysed as follows:
Group Company
2004 2003 2004 2003
£m £m £m £m
4.875% Euro bond due 2004 –859 ––
1.27% Japanese yen bond due 2005 134 139 ––
1.93% Japanese yen bond due 2005 135 140 ––
5.25% Euro bond due 2005 –139 ––
6.35% US dollar bond due 2005 34 125 ––
7.625% US dollar bond due 2005 –995 –995
0.83% Japanese yen bond due 2006 16 16 16 16
1.78% Japanese yen bond due 2006 135 139 ––
5.4% Euro bond due 2006 267 276 267 276
5.75% Euro bond due 2006 1,001 1,032 1,001 1,032
7.5% US dollar bond due 2006 121 258 ––
4.161% US dollar bond due 2007 81 95 81 95
2.575% Japanese yen bond due 2008 136 140 ––
3.95% US dollar bond due 2008 271 315 271 315
4.625% Euro bond due 2008 504 344 504 344
5.5% Euro bond due 2008 32 146 ––
6.25% Sterling bond due 2008 249 248 249 248
6.25% Sterling bond due 2008 160 –160 –
6.65% US dollar bond due 2008 135 316 ––
4.25% Euro bond due 2009 1,266 1,306 1,266 1,306
4.75% Euro bond due 2009 548 567 ––
2.0% Japanese yen bond due 2010 135 139 ––
2.28% Japanese yen bond due 2010 133 136 ––
2.5% Japanese yen bond due 2010 137 141 ––
7.75% US dollar bond due 2010 1,473 1,711 1,487 1,711
5.0% US dollar bond due 2013 540 –540 –
5.125% Euro bond due 2015 333 –333 –
5.375% US dollar bond due 2015 495 251 495 251
5.0% Euro bond due 2018 499 –499 –
4.625% US dollar bond due 2018 270 –270 –
5.625% Sterling bond due 2025 246 –246 –
7.875% US dollar bond due 2030 400 465 400 465
5.9% Sterling bond due 2032 443 443 443 443
6.25% US dollar bond due 2032 267 310 267 310
10,596 11,191 8,795 7,807
Finance leases are repayable as follows:
Repayable in more than one year but not more than two years 11 47 ––
Repayable in more than two years but not more than five years 30 39 ––
Repayable in more than five years 83 95 ––
124 181 ––
18. Creditors: amounts falling due after more than one year continued