Vodafone 2004 Annual Report Download - page 116
Download and view the complete annual report
Please find page 116 of the 2004 Vodafone annual report below. You can navigate through the pages in the report by either clicking on the pages listed below, or by using the keyword search tool below to find specific information within the annual report.-
 1
1 -
2
-
3
-
4
-
5
-
6
-
7
-
8
-
9
-
10
-
11
-
12
-
13
-
14
-
15
-
16
-
17
-
18
-
19
-
20
-
21
-
22
-
23
-
24
-
25
-
26
-
27
-
28
-
29
-
30
-
31
-
32
-
33
-
34
-
35
-
36
-
37
-
38
-
39
-
40
-
41
-
42
-
43
-
44
-
45
-
46
-
47
-
48
-
49
-
50
-
51
-
52
-
53
-
54
-
55
-
56
-
57
-
58
-
59
-
60
-
61
-
62
-
63
-
64
-
65
-
66
-
67
-
68
-
69
-
70
-
71
-
72
-
73
-
74
-
75
-
76
-
77
-
78
-
79
-
80
-
81
-
82
-
83
-
84
-
85
-
86
-
87
-
88
-
89
-
90
-
91
-
92
-
93
-
94
-
95
-
96
-
97
-
98
-
99
-
100
-
101
-
102
-
103
-
104
-
105
-
 106
106 -
 107
107 -
 108
108 -
 109
109 -
 110
110 -
 111
111 -
 112
112 -
 113
113 -
 114
114 -
 115
115 -
 116
116 -
 117
117 -
 118
118 -
 119
119 -
 120
120 -
 121
121 -
 122
122 -
 123
123 -
 124
124 -
 125
125 -
 126
126 -
127
-
128
-
129
-
130
-
131
-
132
-
133
-
134
-
135
-
136
-
137
-
138
-
139
-
140
-
141
-
142
 |
 |
Vodafone Group Plc Annual Report 2004
114
Notes to the Consolidated Financial Statements continued
36. US GAAP information
Index
Page Page
Reconciliations to US GAAP 114 Summary of differences between UK GAAP and US GAAP 117
Net loss for the years ended 31 March 114 Market risk and financial instruments 120
Shareholders’ equity at 31 March 115 Goodwill and other intangible assets 120
Total assets at 31 March 115 Associated undertakings 122
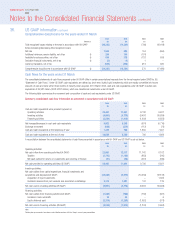
Comprehensive (loss)/income for the years ended 31 March 116 Fixed asset investments 123
Cash flows for the years ended 31 March 116 Stock based compensation 123
Pensions and other post retirement benefits 124
Reconciliations to US GAAP
The following is a summary of the effects of the differences between US GAAP and UK GAAP. The translation of pounds sterling amounts into US dollars is
provided solely for convenience based on the Noon Buying Rate on 31 March 2004 of $1.8400: £1.
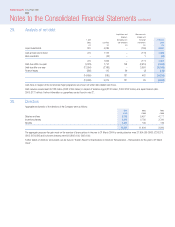
Net loss for the years ended 31 March
2004 2004 2003 2002
Reference $m £m £m £m
Revenues from continuing operations in accordance with UK GAAP(1) 60,244 32,741 28,547 21,767
Items (decreasing)/increasing revenues:
Non-consolidated entities (a) (9,708) (5,276) (4,371) (4,162)
Connection revenues (b) 346 188 (1,760) (1,044)
Revenues from continuing operations in accordance with US GAAP(1) 50,882 27,653 22,416 16,561
Net loss as reported in accordance with UK GAAP (16,588) (9,015) (9,819) (16,155)
Items (increasing)/decreasing net loss:
Investments accounted for under the equity method (a) 2,491 1,354 289 (537)
Connection revenues and costs (b) 53 29 16 (15)
Goodwill and other intangible assets (c) (11,997) (6,520) (5,487) (5,120)
Licence fee amortisation (d) (140) (76) (6) –
Exceptional items (e) (646) (351) 270 (85)
Capitalised interest (f) 747 406 408 387
Income taxes (g) 11,377 6,183 5,320 4,873
Other (i) (251) (137) (46) (53)
Net loss before change in accounting principle, in accordance
with US GAAP (14,954) (8,127) (9,055) (16,705)
Effect of change in accounting principle(2) ––– 17
Net loss after change in accounting principle, in accordance
with US GAAP (14,954) (8,127) (9,055) (16,688)
US GAAP basic and diluted loss per share: (k)
– from continuing operations(1) (20.90)¢ (11.36)p (13.40)p (24.20)p
– net loss (21.95)¢ (11.93)p (13.29)p (24.56)p