Vodafone 2004 Annual Report Download - page 80
Download and view the complete annual report
Please find page 80 of the 2004 Vodafone annual report below. You can navigate through the pages in the report by either clicking on the pages listed below, or by using the keyword search tool below to find specific information within the annual report.-
 1
1 -
2
-
3
-
4
-
5
-
6
-
7
-
8
-
9
-
10
-
11
-
12
-
13
-
14
-
15
-
16
-
17
-
18
-
19
-
20
-
21
-
22
-
23
-
24
-
25
-
26
-
27
-
28
-
29
-
30
-
31
-
32
-
33
-
34
-
35
-
36
-
37
-
38
-
39
-
40
-
41
-
42
-
43
-
44
-
45
-
46
-
47
-
48
-
49
-
50
-
51
-
52
-
53
-
54
-
55
-
56
-
57
-
58
-
59
-
60
-
61
-
62
-
63
-
64
-
65
-
66
-
67
-
68
-
69
-
 70
70 -
 71
71 -
 72
72 -
 73
73 -
 74
74 -
 75
75 -
 76
76 -
 77
77 -
 78
78 -
 79
79 -
 80
80 -
 81
81 -
 82
82 -
 83
83 -
 84
84 -
 85
85 -
 86
86 -
 87
87 -
 88
88 -
 89
89 -
 90
90 -
91
-
92
-
93
-
94
-
95
-
96
-
97
-
98
-
99
-
100
-
101
-
102
-
103
-
104
-
105
-
106
-
107
-
108
-
109
-
110
-
111
-
112
-
113
-
114
-
115
-
116
-
117
-
118
-
119
-
120
-
121
-
122
-
123
-
124
-
125
-
126
-
127
-
128
-
129
-
130
-
131
-
132
-
133
-
134
-
135
-
136
-
137
-
138
-
139
-
140
-
141
-
142
 |
 |
Vodafone Group Plc Annual Report 2004
78
Notes to the Consolidated Financial Statements continued
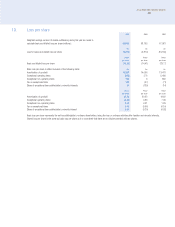
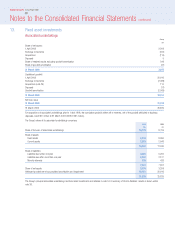
4. Exceptional operating items
2004 2003 2002
£m £m £m
Contribution tax 351 ––
Reorganisation costs (123) (91) (86)
Impairment of intangible and tangible fixed assets –(485) (5,100)
Share of exceptional operating items of associated undertakings and joint ventures ––(222)
228 (576) (5,408)
The net exceptional operating income for 2004 of £228 million comprises £351 million of expected recoveries and provision releases in relation to a contribution
tax levy on Vodafone Italy that is no longer expected to be payable and reorganisation costs of £123 million primarily relating to the Group’s operations in the UK.
The impairment charges for 2003 of £485 million relate to the carrying value of goodwill for Grupo Iusacell (£80 million) and tangible fixed assets in Japan
Telecom (£405 million). Reorganisation costs of £91 million relate to the integration of Vizzavi and related restructuring of the Group’s internet portal activities.
Exceptional operating items for 2002 of £5,408 million primarily relate to impairment charges of £5,100 million in relation to the carrying value of goodwill for
Arcor, Cegetel Group, Grupo Iusacell and Japan Telecom, £86 million reorganisation costs which relate to the Group’s operations in Australia and the UK and
£222 million for the Group’s share of exceptional items of its associated undertakings and joint ventures, which principally comprise £102 million of, principally,
asset write-downs in Vodafone Japan and £115 million of reorganisation costs in Verizon Wireless and Vizzavi.
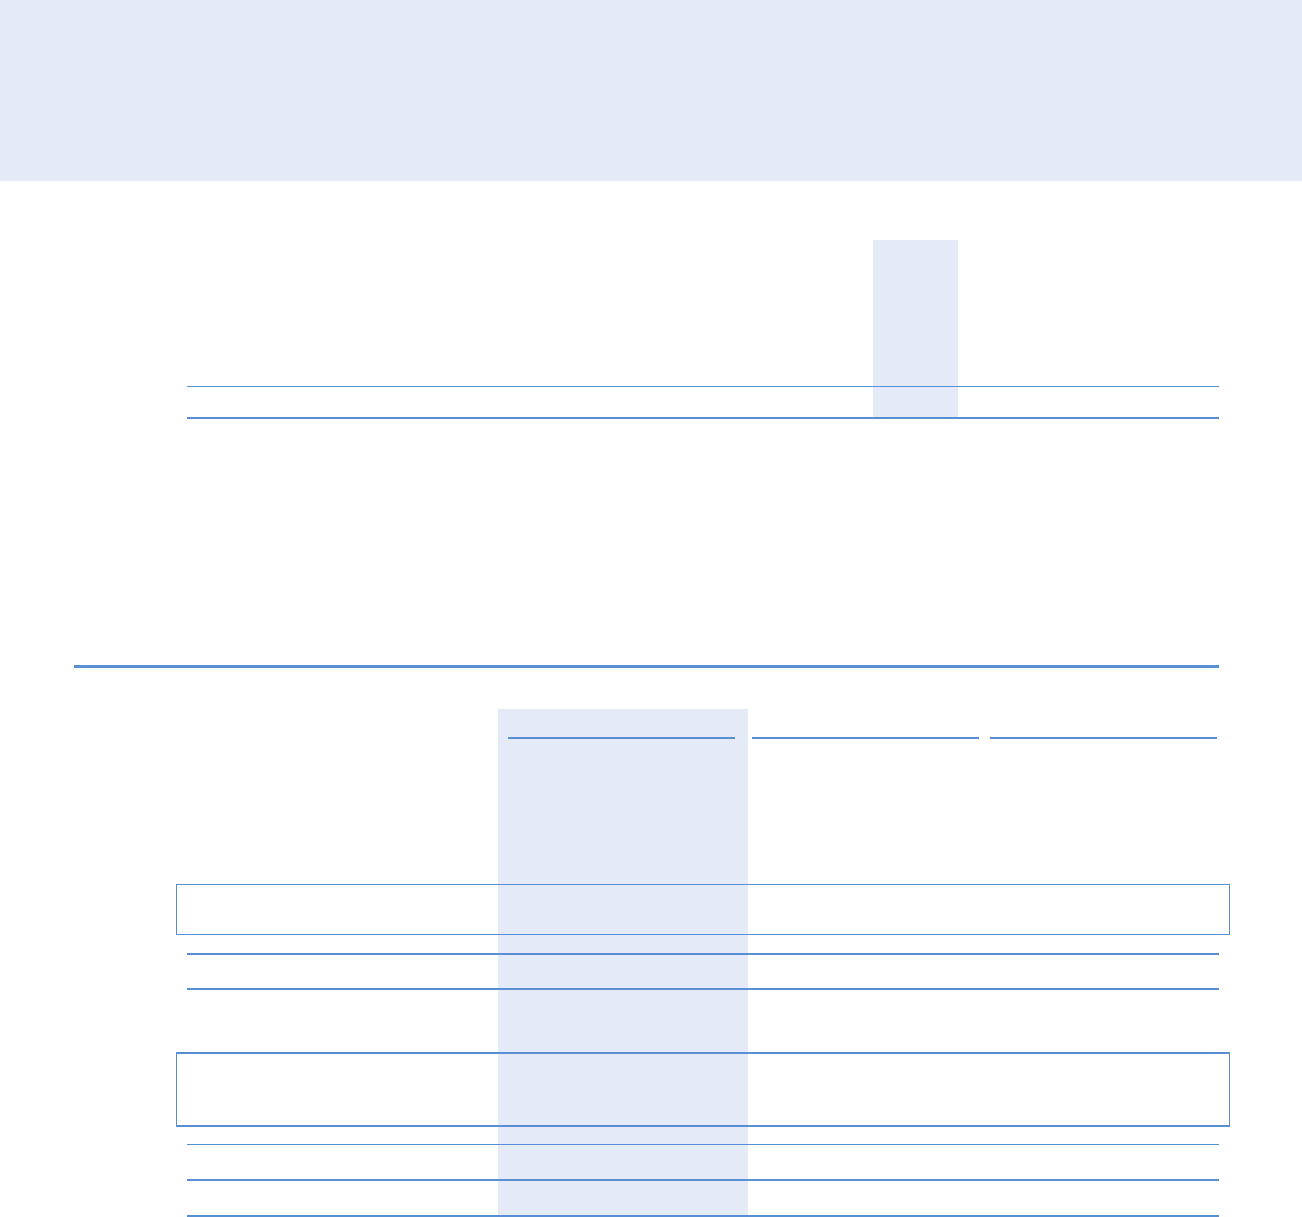
5. Operating loss
2004 2003 2002
Continuing Discontinued Continuing Discontinued Continuing Discontinued
operations operations Total operations operations Total operations operations Total
£m £m £m £m £m £m £m £m £m
Group turnover 32,741 818 33,559 28,547 1,828 30,375 21,767 1,078 22,845
Cost of sales (18,986) (475) (19,461) (16,910) (986) (17,896) (12,795) (651) (13,446)
Exceptional operating items 351 – 351 –– ––––
Other cost of sales (19,337) (475) (19,812) (16,910) (986) (17,896) (12,795) (651) (13,446)
Gross profit 13,755 343 14,098 11,637 842 12,479 8,972 427 9,399
Selling and distribution costs (2,065) (14) (2,079) (1,863) (20) (1,883) (1,445) (12) (1,457)
Administrative expenses (16,532) (263) (16,795) (14,826) (1,065) (15,891) (17,493) (826) (18,319)
Goodwill amortisation (13,095) – (13,095) (11,875) – (11,875) (10,949) (13) (10,962)
Exceptional operating items (123) –(123) (91) (405) (496) (4,086) (400) (4,486)
Other administration expenses (3,314) (263) (3,577) (2,860) (660) (3,520) (2,458) (413) (2,871)
Total operating expenses (18,597) (277) (18,874) (16,689) (1,085) (17,774) (18,938) (838) (19,776)
Operating loss (4,842) 66 (4,776) (5,052) (243) (5,295) (9,966) (411) (10,377)
The results of Japan Telecom, which has been disposed of, are analysed as discontinued operations and prior periods’ analyses are restated to reflect this
business as discontinued.