Vodafone 2004 Annual Report Download - page 41
Download and view the complete annual report
Please find page 41 of the 2004 Vodafone annual report below. You can navigate through the pages in the report by either clicking on the pages listed below, or by using the keyword search tool below to find specific information within the annual report.-
 1
1 -
2
-
3
-
4
-
5
-
6
-
7
-
8
-
9
-
10
-
11
-
12
-
13
-
14
-
15
-
16
-
17
-
18
-
19
-
20
-
21
-
22
-
23
-
24
-
25
-
26
-
27
-
28
-
29
-
30
-
 31
31 -
 32
32 -
 33
33 -
 34
34 -
 35
35 -
 36
36 -
 37
37 -
 38
38 -
 39
39 -
 40
40 -
 41
41 -
 42
42 -
 43
43 -
 44
44 -
 45
45 -
 46
46 -
 47
47 -
 48
48 -
 49
49 -
 50
50 -
 51
51 -
52
-
53
-
54
-
55
-
56
-
57
-
58
-
59
-
60
-
61
-
62
-
63
-
64
-
65
-
66
-
67
-
68
-
69
-
70
-
71
-
72
-
73
-
74
-
75
-
76
-
77
-
78
-
79
-
80
-
81
-
82
-
83
-
84
-
85
-
86
-
87
-
88
-
89
-
90
-
91
-
92
-
93
-
94
-
95
-
96
-
97
-
98
-
99
-
100
-
101
-
102
-
103
-
104
-
105
-
106
-
107
-
108
-
109
-
110
-
111
-
112
-
113
-
114
-
115
-
116
-
117
-
118
-
119
-
120
-
121
-
122
-
123
-
124
-
125
-
126
-
127
-
128
-
129
-
130
-
131
-
132
-
133
-
134
-
135
-
136
-
137
-
138
-
139
-
140
-
141
-
142
 |
 |

Annual Report 2004 Vodafone Group Plc
39
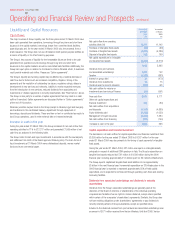
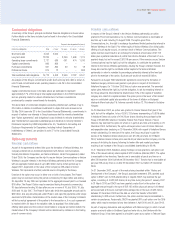
Balance Sheet
Certain comparative amounts have been restated as a result of changing accounting
standards as described in note 37 “Changes in accounting standards”.
Assets
Intangible fixed assets decreased from £108,085 million at 31 March 2003 to
£93,622 million at 31 March 2004, as a result of £13,095 million of goodwill
amortisation and £98 million of other amortisation charges to the profit and loss
account in the 2004 financial year and £2,714 million of exchange movements,
partially offset by £1,434 million of goodwill arising on acquisitions made in the 2004
financial year. See “Business Overview – History and Development of the Company –
Acquisitions of businesses”.
Tangible fixed assets decreased from £19,574 million at 31 March 2003 to £18,083
million at 31 March 2004 as a result of £4,362 million depreciation charges in the
2004 financial year and assets disposed of with Japan Telecom, offset by £4,751
million of additions during the year. Network infrastructure assets of £14,823 million
(2003: £16,230 million) represented approximately 82% (2003: 83%) of the total
tangible fixed asset base at 31 March 2004. Additions to network infrastructure in the
year totalled £3,299 million. The capital expenditure on 3G network infrastructure is
discussed in “Business Overview – Licences and network infrastructure”. The net book
value of tangible fixed assets resulting from the disposal of Japan Telecom during the
year amounted to £1,309 million.
The Group’s investments in associated undertakings reduced from £25,825 million at
31 March 2003 to £21,226 million at 31 March 2004 mainly as result of £2,830
million of exchange movements and £2,112 million of goodwill amortisation charges
in the 2004 financial year.
Other fixed asset investments at 31 March 2004 totalled £1,049 million (2003:
£1,164 million) and include the Group’s equity interest in China Mobile.
Current assets increased to £13,149 million from £8,591 million principally as a
result of the increase in cash and liquid investments in the 2004 financial year. See
“Liquidity and Capital Resources – Cash flows”.
Liabilities
The Group’s total liabilities increased by only 1.4% over the 2004 financial year.
Equity shareholders’ funds
Total equity shareholders’ funds decreased from £128,630 million at 31 March 2003
to £111,924 million at 31 March 2004. The decrease comprises the loss for the year
of £9,015 million (which includes goodwill amortisation of £15,207 million and
exceptional items, net of tax and minority interests, of £6 million), equity dividends of
£1,378 million, net currency translation losses of £5,292 million, purchases of
treasury shares of £1,088 million and £19 million of other movements, offset by the
issue of new share capital of £86 million.
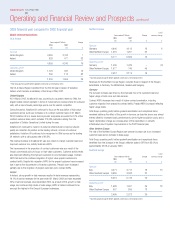
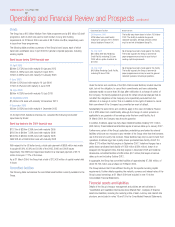
Equity Dividends
The table below sets out the amounts of interim, final and total cash dividends paid or,
in the case of the final dividend for the 2004 financial year, proposed in respect of
each financial year indicated both in pence per ordinary share and translated, solely
for convenience, into cents per ordinary share at the Noon Buying Rate on each of the
respective payment dates for such interim and final dividends.
Pence per ordinary share Cents per ordinary share
Year ended 31 March Interim Final Total Interim Final Total
2000 0.6550 0.6800 1.3350 1.0430 1.0227 2.0657
2001 0.6880 0.7140 1.4020 0.9969 1.0191 2.0160
2002 0.7224 0.7497 1.4721 1.0241 1.1422 2.1663
2003 0.7946 0.8983 1.6929 1.2939 1.4445 2.7384
2004 0.9535 1.0780(1) 2.0315 1.7601 1.9305(2) 3.6906
Notes:
(1) The final dividend for the year was proposed on 25 May 2004 and is payable on 6 August
2004 to holders of record as of 4 June 2004.
(2) The final dividend will be payable in US dollars to ADS holders under the terms of the deposit
agreement. The final dividend in sterling has been translated at the Noon Buying Rate at
24 May 2004.
The Company has historically paid dividends semi-annually, with the regular interim
dividend payable in February and the regular final dividend payable in August. The
directors expect that the Company will continue to pay dividends semi-annually.
In considering the level of dividend to declare and recommend, the Board takes
account of the outlook for earnings growth, operating cash flow generation, capital
expenditure requirements, acquisitions and divestments together with the possibilities
for debt reductions and share purchases. Accordingly, the directors are recommending
a final dividend of 1.0780 pence per share, bringing the total for the year to 2.0315
pence per share, representing a 20% increase over last year’s total dividend. The
Board expects progressively to increase the payout ratio in the future.
Cash dividends, if any, will be paid by the Company in respect of ordinary shares in
pounds sterling or, to holders of ordinary shares with a registered address in a country
which has adopted the euro as its national currency, in euro, unless shareholders wish
to elect to continue to receive dividends in sterling, are participating in the Company’s
Dividend Restatement Plan, or have mandated their dividend payment to be paid
directly into a bank or building society account in the United Kingdom. In accordance
with the Company’s Articles of Association, the sterling: euro exchange rate will be
determined by the Company shortly before the payment date.
The Company will pay the ADS Depositary, The Bank of New York, its dividend in US
dollars. The sterling: US dollar exchange rate for this purpose will be determined by
the Company shortly before the payment date. Cash dividends to ADS holders will be
paid by the ADS Depositary in US dollars.
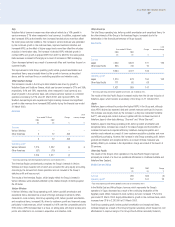
US GAAP Reconciliation
Net loss under US GAAP for the year ended 31 March 2004 was £8,127 million
(2003: £9,055 million). This compares with a net loss of £9,015 million (2003:
£9,819 million) under UK GAAP. The principal differences between US GAAP and UK
GAAP, as they relate to the determination of net loss, are the methods of accounting
for intangible assets, capitalisation of interest and taxation.
In the year to 31 March 2004, revenues from continuing operations under US GAAP
were £27,653 million compared with revenues from continuing operations under UK
GAAP of £32,741 million. In the year to 31 March 2003, revenues from continuing
operations under US GAAP were £22,416 million compared with revenues from
continuing operations under UK GAAP of £28,547 million. The difference in both
periods relates primarily to the non-consolidation of Vodafone Italy. The existence of
significant participating rights of minority shareholders has required the equity method
of accounting to be adopted under US GAAP rather than the full consolidation of
results under UK GAAP. This has not affected the net income of the Group.
For a further explanation of the differences between UK GAAP and US GAAP, including
a summary of the impact of recently issued US accounting standards, see note 36 to
the Consolidated Financial Statements, “US GAAP information”.