Vodafone 2004 Annual Report Download - page 25
Download and view the complete annual report
Please find page 25 of the 2004 Vodafone annual report below. You can navigate through the pages in the report by either clicking on the pages listed below, or by using the keyword search tool below to find specific information within the annual report.-
 1
1 -
2
-
3
-
4
-
5
-
6
-
7
-
8
-
9
-
10
-
11
-
12
-
13
-
14
-
 15
15 -
 16
16 -
 17
17 -
 18
18 -
 19
19 -
 20
20 -
 21
21 -
 22
22 -
 23
23 -
 24
24 -
 25
25 -
 26
26 -
 27
27 -
 28
28 -
 29
29 -
 30
30 -
 31
31 -
 32
32 -
 33
33 -
 34
34 -
 35
35 -
36
-
37
-
38
-
39
-
40
-
41
-
42
-
43
-
44
-
45
-
46
-
47
-
48
-
49
-
50
-
51
-
52
-
53
-
54
-
55
-
56
-
57
-
58
-
59
-
60
-
61
-
62
-
63
-
64
-
65
-
66
-
67
-
68
-
69
-
70
-
71
-
72
-
73
-
74
-
75
-
76
-
77
-
78
-
79
-
80
-
81
-
82
-
83
-
84
-
85
-
86
-
87
-
88
-
89
-
90
-
91
-
92
-
93
-
94
-
95
-
96
-
97
-
98
-
99
-
100
-
101
-
102
-
103
-
104
-
105
-
106
-
107
-
108
-
109
-
110
-
111
-
112
-
113
-
114
-
115
-
116
-
117
-
118
-
119
-
120
-
121
-
122
-
123
-
124
-
125
-
126
-
127
-
128
-
129
-
130
-
131
-
132
-
133
-
134
-
135
-
136
-
137
-
138
-
139
-
140
-
141
-
142
 |
 |

Annual Report 2004 Vodafone Group Plc
23
Contents
Page
Introduction 23
Presentation of Information 23
Foreign Currency Translation 24
Inflation 24
Critical Accounting Estimates 24
Operating Results 28
– Group overview 28
2004 financial year compared to 2003 financial year 28
2003 financial year compared to 2002 financial year 30
– Regional review 32
2004 financial year compared to 2003 financial year 32
2003 financial year compared to 2002 financial year 36
Summary of Key Performance Indicators for principal markets 38
Balance Sheet 39
Equity Dividends 39
US GAAP Reconciliation 39
Liquidity and Capital Resources 40
– Cash flows 40
– Funding 41
– Financial assets and liabilities 42
– Contractual obligations 43
– Option agreements 43
– Off-balance sheet arrangements 44
Quantitative and Qualitative Disclosures About Market Risk 44
Trend Information and Outlook 44
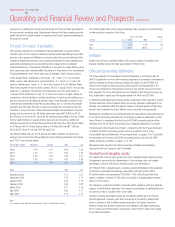
Introduction
The following discussion is based on the Consolidated Financial Statements included
elsewhere in this Annual Report. Such Consolidated Financial Statements are prepared
in accordance with Generally Accepted Accounting Principles in the United Kingdom,
or UK GAAP, which differ in certain significant respects from US GAAP. Reconciliations
of the material differences in the UK GAAP Consolidated Financial Statements to US
GAAP are disclosed in note 36 to the Consolidated Financial Statements, “US GAAP
information”.
The directors have endeavoured to follow the principles set out in the Accounting
Standards Board’s Statement, “Operating and Financial Review”, which was issued in
January 2003. The information in this regard is provided in this section or elsewhere
in this Annual Report.
Vodafone Group Plc is the world’s leading mobile telecommunications company, with
equity interests in 26 countries across Europe, the United States and Asia Pacific. The
Group has over 133 million registered proportionate mobile customers based on
ownership interests at 31 March 2004. Partner Network arrangements extend the
Group’s footprint by a further 13 countries. As the world’s mobile telecommunications
leader, the Group’s vision is to enrich customers’ lives, helping individuals, businesses
and communities to be more connected in a mobile world. See “Business Overview –
Business strategy”.
The Group currently provides a range of voice and data communication services,
including Short Message Services (“SMS”), Multimedia Messaging Services (“MMS”)
and other data services. Services are provided to both consumer and corporate
customers, through a variety of both prepay and postpay tariff arrangements.
In the majority of the Group’s controlled networks, services are offered over a Global
System for Mobile Communications (“GSM”) network, on which a General Packet
Radio Service (“GPRS”) service is also provided. Where licences have been issued, the
Group has also secured 3G licences in all jurisdictions in which it operates through its
subsidiary undertakings and continues to rollout mobile 3G network infrastructure.
See “Business Overview – Licences and network infrastructure”.
The Group faces a number of significant risks that may impact on its future
performance and activities. Please see “Risk Factors and Legal Proceedings”.
Presentation of Information
In the discussion of the Group’s reported financial position and results, information in
addition to that contained within the Consolidated Financial Statements is presented
because it provides readers with access to additional financial information regularly
reviewed by management and management believes these measures assist investor
assessment of the Group’s performance from period to period. This information is not
uniformly defined by all companies in the Group’s industry. Accordingly, it may not be
comparable with similarly titled measures and disclosures by other companies.
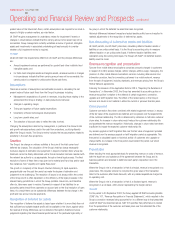
Mobile customer definition
A mobile customer is defined as a subscriber identity module (“SIM”) or, in territories
where SIMs do not exist, a unique mobile telephone number which has access to the
network for any purpose (including data only usage) except telemetric applications.
Telemetric applications include, but are not limited to, asset and equipment tracking,
mobile payment / billing functionality (for example, vending machines and meter
readings) and include voice enabled customers whose usage is limited to a central
service operation (for example, emergency response applications in vehicles).
Activity level
Active customers are defined as customers who have made or received a chargeable
event in the last three months. Where this information is not available, customers who
have made a chargeable event in the last three months are used.
The active customers are expressed as a percentage of the closing customer base.
Contract and prepaid activity is reported separately.
ARPU
ARPU is calculated as total revenues, excluding handset revenues and connection
revenues, divided by the weighted average number of customers in the period. ARPU
is reported externally on a twelve month rolling basis and on a month only basis for
major subsidiaries only.
This performance indicator is commonly used in the mobile telecommunications
industry and by Vodafone management to compare service revenues to prior periods
and internal forecasts. Management believes that this measure provides useful
information for investors regarding trends in customer revenues derived from mobile
telecommunications services and the extent to which customers change their use of
mobile services and the network from period to period.
Churn
Churn is calculated as total gross customer disconnections divided by average total
customers in the period. Stated churn figures are twelve month average figures.
Organic growth
The percentage movements in organic growth are presented to reflect operating
performance on a comparable basis. Where a subsidiary or associated undertaking
was newly acquired or disposed of in the current or prior year, the Group would adjust,
under organic growth calculations, the results for the current and prior year to remove
the amount the Group earned in both periods as a result of the acquisition or disposal
of subsidiary or associated undertakings. Where the Group increases, or decreases, its
ownership interest in an associated undertaking in the current or prior year, the
Group’s share of results for the prior year are restated at the current year’s ownership
level. A further adjustment in organic calculations excludes the effect of exchange rate
Operating and Financial Review and Prospects