Vodafone 2004 Annual Report Download - page 5
Download and view the complete annual report
Please find page 5 of the 2004 Vodafone annual report below. You can navigate through the pages in the report by either clicking on the pages listed below, or by using the keyword search tool below to find specific information within the annual report.-
 1
1 -
 2
2 -
 3
3 -
 4
4 -
 5
5 -
 6
6 -
 7
7 -
 8
8 -
 9
9 -
 10
10 -
 11
11 -
 12
12 -
 13
13 -
 14
14 -
 15
15 -
 16
16 -
17
-
18
-
19
-
20
-
21
-
22
-
23
-
24
-
25
-
26
-
27
-
28
-
29
-
30
-
31
-
32
-
33
-
34
-
35
-
36
-
37
-
38
-
39
-
40
-
41
-
42
-
43
-
44
-
45
-
46
-
47
-
48
-
49
-
50
-
51
-
52
-
53
-
54
-
55
-
56
-
57
-
58
-
59
-
60
-
61
-
62
-
63
-
64
-
65
-
66
-
67
-
68
-
69
-
70
-
71
-
72
-
73
-
74
-
75
-
76
-
77
-
78
-
79
-
80
-
81
-
82
-
83
-
84
-
85
-
86
-
87
-
88
-
89
-
90
-
91
-
92
-
93
-
94
-
95
-
96
-
97
-
98
-
99
-
100
-
101
-
102
-
103
-
104
-
105
-
106
-
107
-
108
-
109
-
110
-
111
-
112
-
113
-
114
-
115
-
116
-
117
-
118
-
119
-
120
-
121
-
122
-
123
-
124
-
125
-
126
-
127
-
128
-
129
-
130
-
131
-
132
-
133
-
134
-
135
-
136
-
137
-
138
-
139
-
140
-
141
-
142
 |
 |

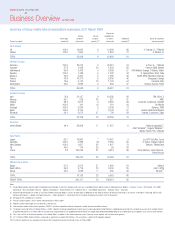
At/year ended 31 March
2004 2004 2003 2002 2001 2000
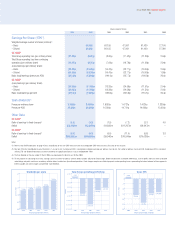
Earnings Per Share (“EPS”)
Weighted average number of shares (millions)(2)
– Basic 68,096 68,155 67,961 61,439 27,100
– Diluted 68,096 68,155 67,961 61,439 27,360
UK GAAP
Total Group operating loss (per ordinary share) (11.43)¢ (6.21)p (8.00)p (17.42)p (11.38)p 2.94p
Total Group operating loss from continuing
operations (per ordinary share) (11.47)¢ (6.31)p (7.64)p (16.79)p (11.38)p 2.94p
(Loss)/earnings (per ordinary share)
– Basic (24.36)¢ (13.24)p (14.41)p (23.77)p (16.09)p 2.00p
– Diluted (24.36)¢ (13.24)p (14.41)p (23.77)p (16.09)p 1.98p
Basic (loss)/earnings (pence per ADS) (243.6)¢ (132.4)p (144.1)p (237.7)p (160.9)p 20.0p
US GAAP
(Loss)/earnings (per ordinary share)
– Basic (21.95)¢ (11.93)p (13.29)p (24.56)p (11.51)p 2.04p
– Diluted (21.95)¢ (11.93)p (13.29)p (24.56)p (11.51)p 2.02p
Basic (loss)/earnings per ADS (219.5)¢ (119.3)p (132.9)p (245.6)p (115.1)p 20.4p
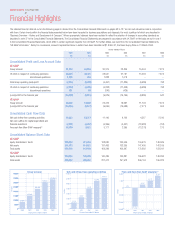
Cash dividends(3)
Pence per ordinary share 3.7380¢ 2.0315p 1.6929p 1.4721p 1.4020p 1.3350p
Pence per ADS 37.380¢ 20.315p 16.929p 14.721p 14.020p 13.350p
Other Data
UK GAAP
Ratio of earnings to fixed charges(4) (1.3) (1.3) (1.9) (7.2) (3.7) 4.0
Deficit $(6,710)m £(3,647)m £(4,828)m £(11,267)m £(6,947)m –
US GAAP
Ratio of earnings to fixed charges(4) (5.7) (5.7) (5.0) (11.0) (5.8) 3.8
Deficit $(19,922)m £(10,827)m £(9,946)m £(16,540)m £(10,038)m –
Notes:
(1) Refer to “Non-GAAP Information” on page 45 for a reconciliation of this non-GAAP measure to the most comparable GAAP measure and a discussion of this measure.
(2) See note 10 to the Consolidated Financial Statements, “Loss per share”. Earnings per ADS is calculated by multiplying earnings per ordinary share by ten, the number of ordinary shares per ADS. Dividend per ADS is calculated
similarly. EPS and dividend information has been restated for the capitalisation (bonus) issue on 30 September 1999.
(3) The final dividend for the year ended 31 March 2004 was proposed by the directors on 25 May 2004.
(4) For the purposes of calculating these ratios, earnings consist of income on ordinary activities before taxation, adjusted for fixed charges, dividend income from associated undertakings, share of profits and losses from associated
undertakings and profits and losses on ordinary activities before taxation from discontinued operations. Fixed charges comprise one-third of payments under operating leases, representing the interest element of these payments,
interest payable and similar charges and preferred share dividends.
Annual Report 2004 Vodafone Group Plc
3
Financial year ended 31 March
0.0
0.5
1.0
1.5
2.0
2.5
20042003200220012000
1.3350p 1.4020p 1.4721p
1.6929p
2.0315p
pence per share
Financial year ended 31 March
20042003200220012000
£798
(£6,989)
(£11,834)
(£5,451)
(£4,230)
£ millions
(14,000)
(12,000)
(10,000)
(8,000)
(6,000)
(4,000)
(2,000)
0
(2,000)
Financial year ended 31 March
20042003200220012000
2.00p
(16.09p)
(23.77p)
(14.41p) (13.24p)
pence per share
(30)
(25)
(20)
(15)
(10)
(5)
0
5
Dividends per share Total Group operating profit/(loss) Basic EPS