Vodafone 2004 Annual Report Download - page 42
Download and view the complete annual report
Please find page 42 of the 2004 Vodafone annual report below. You can navigate through the pages in the report by either clicking on the pages listed below, or by using the keyword search tool below to find specific information within the annual report.-
 1
1 -
2
-
3
-
4
-
5
-
6
-
7
-
8
-
9
-
10
-
11
-
12
-
13
-
14
-
15
-
16
-
17
-
18
-
19
-
20
-
21
-
22
-
23
-
24
-
25
-
26
-
27
-
28
-
29
-
30
-
31
-
 32
32 -
 33
33 -
 34
34 -
 35
35 -
 36
36 -
 37
37 -
 38
38 -
 39
39 -
 40
40 -
 41
41 -
 42
42 -
 43
43 -
 44
44 -
 45
45 -
 46
46 -
 47
47 -
 48
48 -
 49
49 -
 50
50 -
 51
51 -
 52
52 -
53
-
54
-
55
-
56
-
57
-
58
-
59
-
60
-
61
-
62
-
63
-
64
-
65
-
66
-
67
-
68
-
69
-
70
-
71
-
72
-
73
-
74
-
75
-
76
-
77
-
78
-
79
-
80
-
81
-
82
-
83
-
84
-
85
-
86
-
87
-
88
-
89
-
90
-
91
-
92
-
93
-
94
-
95
-
96
-
97
-
98
-
99
-
100
-
101
-
102
-
103
-
104
-
105
-
106
-
107
-
108
-
109
-
110
-
111
-
112
-
113
-
114
-
115
-
116
-
117
-
118
-
119
-
120
-
121
-
122
-
123
-
124
-
125
-
126
-
127
-
128
-
129
-
130
-
131
-
132
-
133
-
134
-
135
-
136
-
137
-
138
-
139
-
140
-
141
-
142
 |
 |

Vodafone Group Plc Annual Report 2004
40
Operating and Financial Review and Prospects continued
Liquidity and Capital Resources
Cash flows
The major sources of Group liquidity over the three years ended 31 March 2004 have
been cash generated from operations, borrowings through long term and short term
issuance in the capital markets, borrowings drawn from committed bank facilities,
asset disposals and, for the year ended 31 March 2002 only, the proceeds from a
share issuance. The Group does not use off-balance sheet special purpose entities as
a source of liquidity or for other financing purposes.
The Group’s key sources of liquidity for the foreseeable future are likely to be cash
generated from operations and borrowings through long term and short term
issuances in the capital markets, as well as committed bank facilities. Additionally, the
Group has a put option in relation to its interest in Verizon Wireless which, if exercised,
could provide material cash inflow. Please see “Option agreements”.
The Group’s liquidity and working capital may be affected by a material decrease in
cash flow due to factors such as increased competition, litigation, timing of tax
payments and the resolution of outstanding tax issues, regulatory rulings, delays in
development of new services and networks, inability to receive expected revenues
from the introduction of new services, reduced dividends from associates and
investments or dividend payments to minority shareholders. See “Risk Factors”, above.
The Group is also party to a number of option agreements that may result in a cash
outflow if exercised. Option agreements are discussed further in “Option agreements”
at the end of this section.
Wherever possible, surplus funds in the Group (except in Albania, Egypt and Hungary)
are transferred to the centralised treasury department through repayment of
borrowings, deposits and dividends. These are then on-lent or contributed as equity to
fund Group operations, used to retire external debt or invested externally.
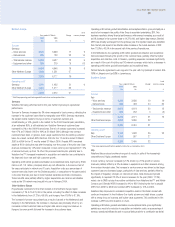
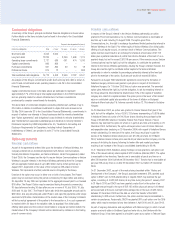
Increase in cash in the year
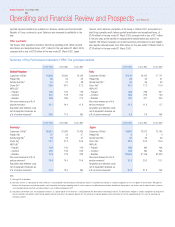
During the year ended 31 March 2004, the Group increased its net cash inflow from
operating activities by 11% to £12,317 million and generated £1,069 million of net
cash flow, as analysed in the following table.
The Group holds its cash and liquid investments in accordance with the counterparty
and settlement risk limits of the Board approved treasury policy. The main forms of
liquid investments at 31 March 2004 were collateralised deposits, money market
funds and euro commercial paper.
Year ended Year ended
31 March 31 March
2004 2003
£m £m
Net cash inflow from operating
activities (Note 28) 12,317 11,142
Purchase of intangible fixed assets (21) (99)
Purchase of tangible fixed assets (4,508) (5,289)
Disposal of tangible fixed assets 158 109
Net capital expenditure on intangible
and tangible fixed assets (4,371) (5,279)
7,946 5,863
Dividends from joint ventures
and associated undertakings 1,801 742
Taxation (1,182) (883)
Interest on group debt 31 (475)
Dividends from investments 25 15
Dividends paid to minority interests (100) (91)
Net cash outflow for returns on
investments and servicing of finance (44) (551)
Free cash flow 8,521 5,171
Other net capital expenditure and
financial investment 104 (80)
Net cash outflow from acquisitions
and disposals (1,312) (4,880)
Equity dividends paid (1,258) (1,052)
Management of liquid resources (4,286) 1,384
Net cash outflow from financing (700) (150)
Increase in cash in the year 1,069 393
Capital expenditure and financial investment
The decrease in net cash outflow for capital expenditure and financial investment from
£5,359 million for the year ended 31 March 2003 to £4,267 million for the year
ended 31 March 2004 was due primarily to the timing of cash payments for tangible
fixed assets.
During the year ended 31 March 2004, £21 million was spent on intangible assets,
principally in respect of additional GSM spectrum in Italy. The Group’s expenditure on
tangible fixed assets reduced by £781 million to £4,508 million during the 2004
financial year, including approximately £1.5 billion spent on 3G network infrastructure.
The Group expects capitalised tangible fixed asset additions to be approximately
£5 billion in the next financial year. Incremental expenditure on 3G infrastructure in the
2005 financial year is expected to represent approximately 35% of total capital
expenditure, and is expected to be financed through operating cash flows and existing
borrowing facilities.
Dividends from associated undertakings and dividends to minority
shareholders
Dividends from the Group’s associated undertakings are generally paid at the
discretion of the Board of directors or shareholders of the individual operating
companies and Vodafone has no rights to receive dividends, except where specified
within certain of the companies’ shareholders’ agreements. Similarly, the Group does
not have existing obligations under shareholders’ agreements to pay dividends to
minority interest partners of Group subsidiaries, except as specified below.
Included in the dividends received from joint ventures and associated undertakings was
an amount of £671 million received from Verizon Wireless. Until April 2005, Verizon