Vodafone 2004 Annual Report Download - page 73
Download and view the complete annual report
Please find page 73 of the 2004 Vodafone annual report below. You can navigate through the pages in the report by either clicking on the pages listed below, or by using the keyword search tool below to find specific information within the annual report.-
 1
1 -
2
-
3
-
4
-
5
-
6
-
7
-
8
-
9
-
10
-
11
-
12
-
13
-
14
-
15
-
16
-
17
-
18
-
19
-
20
-
21
-
22
-
23
-
24
-
25
-
26
-
27
-
28
-
29
-
30
-
31
-
32
-
33
-
34
-
35
-
36
-
37
-
38
-
39
-
40
-
41
-
42
-
43
-
44
-
45
-
46
-
47
-
48
-
49
-
50
-
51
-
52
-
53
-
54
-
55
-
56
-
57
-
58
-
59
-
60
-
61
-
62
-
 63
63 -
 64
64 -
 65
65 -
 66
66 -
 67
67 -
 68
68 -
 69
69 -
 70
70 -
 71
71 -
 72
72 -
 73
73 -
 74
74 -
 75
75 -
 76
76 -
 77
77 -
 78
78 -
 79
79 -
 80
80 -
 81
81 -
 82
82 -
 83
83 -
84
-
85
-
86
-
87
-
88
-
89
-
90
-
91
-
92
-
93
-
94
-
95
-
96
-
97
-
98
-
99
-
100
-
101
-
102
-
103
-
104
-
105
-
106
-
107
-
108
-
109
-
110
-
111
-
112
-
113
-
114
-
115
-
116
-
117
-
118
-
119
-
120
-
121
-
122
-
123
-
124
-
125
-
126
-
127
-
128
-
129
-
130
-
131
-
132
-
133
-
134
-
135
-
136
-
137
-
138
-
139
-
140
-
141
-
142
 |
 |

Annual Report 2004 Vodafone Group Plc
71
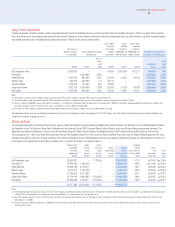
Consolidated Cash Flows
For the years ended 31 March
2003 2002
2004 2004 as restated as restated
Note $m £m £m £m
Net cash inflow from operating activities 28 22,663 12,317 11,142 8,102
Dividends received from joint ventures and associated undertakings 3,314 1,801 742 139
Net cash outflow for returns on investments and servicing of finance 28 (81) (44) (551) (936)
Taxation (2,175) (1,182) (883) (545)
Net cash outflow for capital expenditure and financial investment (7,851) (4,267) (5,359) (4,441)
Purchase of intangible fixed assets (39) (21) (99) (325)
Purchase of tangible fixed assets (8,294) (4,508) (5,289) (4,145)
Purchase of investments (79) (43) (546) (38)
Disposal of tangible fixed assets 291 158 109 75
Disposal of investments 226 123 575 319
Loans to joint ventures ––(59) (233)
Loans repaid by/(to) associated undertakings 44 24 –(523)
Loans to businesses sold or acquired businesses held for sale ––(50) (116)
Loans repaid by acquired businesses held for sale ––– 545
Net cash outflow from acquisitions and disposals (2,414) (1,312) (4,880) (7,691)
Purchase of interests in subsidiary undertakings (3,797) (2,064) (3,519) (3,078)
Net cash/(overdrafts) acquired with subsidiary undertakings 18 10 11 (2,514)
Purchase of interests in associated undertakings ––(1,491) (7,159)
Purchase of customer bases ––(6) (11)
Disposal of interests in subsidiary undertakings 1,831 995 125 –
Net cash disposed of with subsidiary undertakings (475) (258) ––
Disposal of interests in joint ventures and associated undertakings 95––
Disposal of acquired businesses held for sale ––– 5,071
Equity dividends paid (2,315) (1,258) (1,052) (978)
Cash inflow/(outflow) before management of liquid resources and financing 11,141 6,055 (841) (6,350)
Management of liquid resources 29 (7,886) (4,286) 1,384 7,042
Net cash outflow from financing 28 (1,288) (700) (150) (681)
Issue of ordinary share capital 127 69 28 3,581
Increase/(decrease) in debt 515 280 (165) (4,268)
Issue of shares to minorities ––112
Purchase of treasury shares (1,899) (1,032) ––
Purchase of own shares in relation to employee share schemes (31) (17) (14) (6)
Increase in cash in the year 1,967 1,069 393 11
Reconciliation of net cash flow to movement in net debt
Increase in cash in the year 29 1,967 1,069 393 11
Cash (inflow)/outflow from (increase)/decrease in debt 29 (515) (280) 165 4,268
Cash outflow/(inflow) from increase/(decrease) in liquid resources 29 7,886 4,286 (1,384) (7,042)
Decrease/(increase) in net debt resulting from cash flows 29 9,338 5,075 (826) (2,763)
Net debt acquired on acquisition of subsidiary undertakings (13) (7) – (3,116)
Net debt disposed of on disposal of subsidiary undertakings 357 194 ––
Translation difference 265 144 (826) 517
Premium on repayment of debt (103) (56) (157) –
Other movements 21450
Decrease/(increase) in net debt in the year 9,846 5,351 (1,805) (5,312)
Opening net debt (25,464) (13,839) (12,034) (6,722)
Closing net debt 29 (15,618) (8,488) (13,839) (12,034)
The accompanying notes are an integral part of these Consolidated Financial Statements.
The unaudited US dollar amounts are prepared on the basis set out in note 1.