Vodafone 2004 Annual Report Download - page 40
Download and view the complete annual report
Please find page 40 of the 2004 Vodafone annual report below. You can navigate through the pages in the report by either clicking on the pages listed below, or by using the keyword search tool below to find specific information within the annual report.-
 1
1 -
2
-
3
-
4
-
5
-
6
-
7
-
8
-
9
-
10
-
11
-
12
-
13
-
14
-
15
-
16
-
17
-
18
-
19
-
20
-
21
-
22
-
23
-
24
-
25
-
26
-
27
-
28
-
29
-
 30
30 -
 31
31 -
 32
32 -
 33
33 -
 34
34 -
 35
35 -
 36
36 -
 37
37 -
 38
38 -
 39
39 -
 40
40 -
 41
41 -
 42
42 -
 43
43 -
 44
44 -
 45
45 -
 46
46 -
 47
47 -
 48
48 -
 49
49 -
 50
50 -
51
-
52
-
53
-
54
-
55
-
56
-
57
-
58
-
59
-
60
-
61
-
62
-
63
-
64
-
65
-
66
-
67
-
68
-
69
-
70
-
71
-
72
-
73
-
74
-
75
-
76
-
77
-
78
-
79
-
80
-
81
-
82
-
83
-
84
-
85
-
86
-
87
-
88
-
89
-
90
-
91
-
92
-
93
-
94
-
95
-
96
-
97
-
98
-
99
-
100
-
101
-
102
-
103
-
104
-
105
-
106
-
107
-
108
-
109
-
110
-
111
-
112
-
113
-
114
-
115
-
116
-
117
-
118
-
119
-
120
-
121
-
122
-
123
-
124
-
125
-
126
-
127
-
128
-
129
-
130
-
131
-
132
-
133
-
134
-
135
-
136
-
137
-
138
-
139
-
140
-
141
-
142
 |
 |

Vodafone Group Plc Annual Report 2004
38
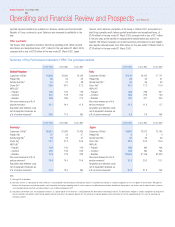
Operating and Financial Review and Prospects continued
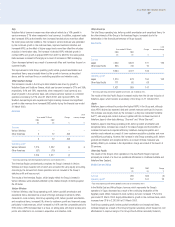
reported improved results as its operations in Tanzania, Lesotho and the Democratic
Republic of Congo continued to grow. Safaricom also improved its profitability in the
year.
Other operations
The Group’s other operations reported a total Group operating profit, before goodwill
amortisation and exceptional items, of £11 million for the year ended 31 March 2003,
compared with a loss of £323 million for the year ended 31 March 2002. Japan
Telecom, which became a subsidiary of the Group in October 2001, accounted for a
total Group operating profit, before goodwill amortisation and exceptional items, of
£149 million for the year ended 31 March 2003, compared with a loss of £17 million
in the prior year, as the benefits of management’s transformation plan start to be
realised. The Group’s European non-mobile businesses, principally Arcor and Cegetel,
also reported reduced losses, from £306 million for the year ended 31 March 2002 to
£138 million for the year ended 31 March 2003.
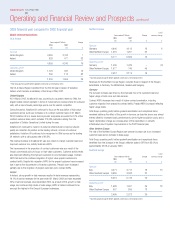
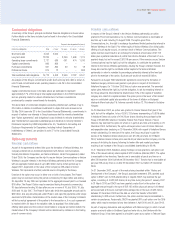
31 Mar 2004 31 Mar 2003 31 Mar 2002
United Kingdom
Customers (’000s)(1) 14,095 13,300 13,186
Prepaid (%) 60 59 62
Activity level (%)(1) 91 91 89
Churn (%)(1) 29.6 30.0 27.3
ARPU (£)(1)
– Prepaid 130 125 118
– Contract 551 518 555
– Blended 309 286 276
Non-voice revenue as a % of
service revenues(2) 16.1 14.4 11.8
Acquisition and retention costs
net of equipment revenues, as
a % of service revenues(3) 15.6 11.9 N/A
31 Mar 2004 31 Mar 2003 31 Mar 2002
Germany
Customers (’000s)(1) 25,012 22,940 21,434
Prepaid (%) 51 53 57
Activity level (%)(1) 93 92 91
Churn (%)(1) 18.7 21.2 23.5
ARPU (1)(1)
– Prepaid 130 130 110
– Contract 494 519 559
– Blended 310 313 298
Non-voice revenue as a % of
service revenues(2) 17.4 16.4 14.4
Acquisition and retention costs
net of equipment revenues, as
a % of service revenues(3) 13.4 12.6 N/A
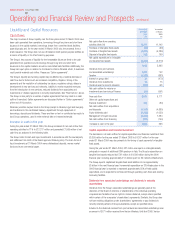
31 Mar 2004 31 Mar 2003 31 Mar 2002
Italy
Customers (’000s)(1) 21,137 19,412 17,711
Prepaid (%) 92 92 91
Activity level (%)(1) 93 95 93
Churn (%)(1) 16.7 17.3 18.9
ARPU (a)(1)
– Prepaid 309 298 297
– Contract 900 818 769
– Blended 361 347 345
Non-voice revenue as a % of
service revenues(2) 13.3 11.3 8.7
Acquisition and retention costs
net of equipment revenues, as
a % of service revenues(3) 2.8 3.4 N/A
31 Mar 2004 31 Mar 2003 31 Mar 2002
Japan
Customers (’000s)(1) 14,951 13,912 12,185
Prepaid (%) 964
Activity level (%)(1) 97 98 99
Churn (%)(1) 23.0 23.3 25.6
ARPU (¥)
– Prepaid N/A N/A N/A
– Contract N/A N/A N/A
– Blended 80,695 87,159 91,903
Non-voice revenue as a % of
service revenues(2) 21.9 20.3 15.1
Acquisition and retention costs
net of equipment revenues, as
a % of service revenues(3) 21.0 21.9 N/A
Notes:
(1) See page 23 for definitions.
(2) Non-voice services as a percentage of service revenues is calculated before the elimination of intercompany revenue. This performance indicator is used by management to assess the growth in data revenues. Management
believes that this performance indicator provides useful information for investors regarding trends in service revenues in mobile telecommunications derived from data products and services and the extent to which customers
are increasing or decreasing their use of data products such as SMS and Vodafone live!™.
(3) Acquisition and retention costs, net of equipment revenues, as a percentage of service revenues is calculated before the elimination of intercompany revenue. This performance indicator is used by management to compare the
level of acquisition and retention activity to prior periods and internal forecasts. Management believes that this performance indicator provides useful information for investors regarding trends in the costs of acquiring and
retaining customers.
Summary of Key Performance Indicators (“KPIs”) for principal markets