Vodafone 2004 Annual Report Download - page 118
Download and view the complete annual report
Please find page 118 of the 2004 Vodafone annual report below. You can navigate through the pages in the report by either clicking on the pages listed below, or by using the keyword search tool below to find specific information within the annual report.-
 1
1 -
2
-
3
-
4
-
5
-
6
-
7
-
8
-
9
-
10
-
11
-
12
-
13
-
14
-
15
-
16
-
17
-
18
-
19
-
20
-
21
-
22
-
23
-
24
-
25
-
26
-
27
-
28
-
29
-
30
-
31
-
32
-
33
-
34
-
35
-
36
-
37
-
38
-
39
-
40
-
41
-
42
-
43
-
44
-
45
-
46
-
47
-
48
-
49
-
50
-
51
-
52
-
53
-
54
-
55
-
56
-
57
-
58
-
59
-
60
-
61
-
62
-
63
-
64
-
65
-
66
-
67
-
68
-
69
-
70
-
71
-
72
-
73
-
74
-
75
-
76
-
77
-
78
-
79
-
80
-
81
-
82
-
83
-
84
-
85
-
86
-
87
-
88
-
89
-
90
-
91
-
92
-
93
-
94
-
95
-
96
-
97
-
98
-
99
-
100
-
101
-
102
-
103
-
104
-
105
-
106
-
107
-
 108
108 -
 109
109 -
 110
110 -
 111
111 -
 112
112 -
 113
113 -
 114
114 -
 115
115 -
 116
116 -
 117
117 -
 118
118 -
 119
119 -
 120
120 -
 121
121 -
 122
122 -
 123
123 -
 124
124 -
 125
125 -
 126
126 -
 127
127 -
 128
128 -
129
-
130
-
131
-
132
-
133
-
134
-
135
-
136
-
137
-
138
-
139
-
140
-
141
-
142
 |
 |

Vodafone Group Plc Annual Report 2004
116
Notes to the Consolidated Financial Statements continued
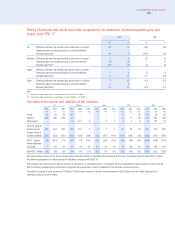
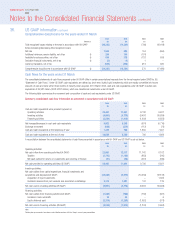
Comprehensive (loss)/income for the years ended 31 March
2004 2004 2003 2002
Reference $m £m £m £m
Total recognised losses relating to the year in accordance with UK GAAP (26,325) (14,307) (780) (18,418)
Items (increasing)/decreasing total recognised losses:
Net loss 1,634 888 764 (550)
Additional minimum pension liability, net of tax (i) 265 144 (191) –
Available for sale securities, net of tax (i) 696 378 (137) 808
Derivative financial instruments, net of tax (i) (2) (1) 1 –
Currency translation, net of tax (650) (353) 913 680
Comprehensive (loss)/income in accordance with US GAAP (j) (24,382) (13,251) 570 (17,480)
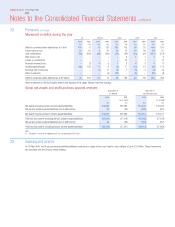
Cash flows for the years ended 31 March
The consolidated statements of cash flows prepared under UK GAAP differ in certain presentational respects from the format required under SFAS No. 95,
“Statement of Cash Flows”. Under US GAAP, cash equivalents are defined as short term, highly liquid investments which are readily convertible into known
amounts of cash and were within three months of maturity when acquired. At 31 March 2004, cash and cash equivalents under US GAAP included cash
equivalents of £4,381 million (2003: £291 million), which are classified as investments under UK GAAP.
The following table summarises the movement and composition of cash and cash equivalents under US GAAP.
Summary consolidated cash flow information as presented in accordance with US GAAP:
2004 2004 2003 2002
$m £m £m £m
Cash and cash equivalents were provided by/(used in):
Operating activities 20,407 11,091 9,708 6,621
Investing activities (6,951) (3,778) (9,497) (10,684)
Financing activities (3,524) (1,915) (1,202) (1,653)
Net increase/(decrease) in cash and cash equivalents 9,932 5,398 (991) (5,716)
Exchange movement (688) (374) (112) (76)
Cash and cash equivalents at the beginning of year 1,410 766 1,869 7,661
Cash and cash equivalents at the end of year 10,654 5,790 766 1,869
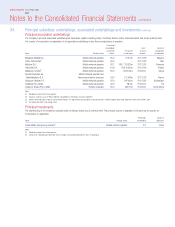
A reconciliation between the consolidated statements of cash flows presented in accordance with UK GAAP and US GAAP is set out below.
2004 2004 2003 2002
$m £m £m £m
Operating activities:
Net cash inflow from operating activities (UK GAAP) 22,663 12,317 11,142 8,102
Taxation (2,175) (1,182) (883) (545)
Net cash outflow for returns on investments and servicing of finance (81) (44) (551) (936)
Net cash provided by operating activities (US GAAP) 20,407 11,091 9,708 6,621
Investing activities:
Net cash outflow from capital expenditure, financial investments and
acquisitions and disposals (UK GAAP) (10,265) (5,579) (10,239) (12,132)
Acquisition of liquid investments ––– 1,309
Dividends received from joint ventures and associated undertakings 3,314 1,801 742 139
Net cash used in investing activities (US GAAP) (6,951) (3,778) (9,497) (10,684)
Financing activities:
Net cash outflow from financing activities (UK GAAP) (1,288) (700) (150) (681)
Increase in bank overdrafts 79 43 – 6
Equity dividends paid (2,315) (1,258) (1,052) (978)
Net cash used in financing activities (US GAAP) (3,524) (1,915) (1,202) (1,653)
Note:
Certain prior year amounts have been reclassified to conform with the Group’s current year presentation.
36. US GAAP information continued