Vodafone 2004 Annual Report Download - page 32
Download and view the complete annual report
Please find page 32 of the 2004 Vodafone annual report below. You can navigate through the pages in the report by either clicking on the pages listed below, or by using the keyword search tool below to find specific information within the annual report.-
 1
1 -
2
-
3
-
4
-
5
-
6
-
7
-
8
-
9
-
10
-
11
-
12
-
13
-
14
-
15
-
16
-
17
-
18
-
19
-
20
-
21
-
 22
22 -
 23
23 -
 24
24 -
 25
25 -
 26
26 -
 27
27 -
 28
28 -
 29
29 -
 30
30 -
 31
31 -
 32
32 -
 33
33 -
 34
34 -
 35
35 -
 36
36 -
 37
37 -
 38
38 -
 39
39 -
 40
40 -
 41
41 -
 42
42 -
43
-
44
-
45
-
46
-
47
-
48
-
49
-
50
-
51
-
52
-
53
-
54
-
55
-
56
-
57
-
58
-
59
-
60
-
61
-
62
-
63
-
64
-
65
-
66
-
67
-
68
-
69
-
70
-
71
-
72
-
73
-
74
-
75
-
76
-
77
-
78
-
79
-
80
-
81
-
82
-
83
-
84
-
85
-
86
-
87
-
88
-
89
-
90
-
91
-
92
-
93
-
94
-
95
-
96
-
97
-
98
-
99
-
100
-
101
-
102
-
103
-
104
-
105
-
106
-
107
-
108
-
109
-
110
-
111
-
112
-
113
-
114
-
115
-
116
-
117
-
118
-
119
-
120
-
121
-
122
-
123
-
124
-
125
-
126
-
127
-
128
-
129
-
130
-
131
-
132
-
133
-
134
-
135
-
136
-
137
-
138
-
139
-
140
-
141
-
142
 |
 |

Vodafone Group Plc Annual Report 2004
30
Operating and Financial Review and Prospects continued
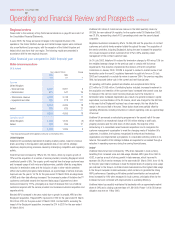
2003 financial year compared to 2002 financial year
Turnover
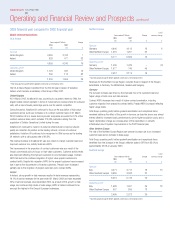
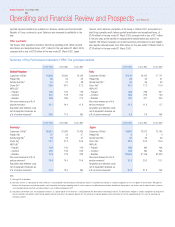
Turnover increased 33% in the 2003 financial year, as analysed below:
Mobile Non-mobile Group
%%%
Impact of
– Organic growth 11 5 11
– Foreign exchange 2 – 2
– Acquisitions & disposals 20 30 20
Reported growth 33 35 33
The impact of acquisitions and disposals mainly comprised Vodafone Japan and Japan
Telecom, which both became subsidiaries from October 2001. Changes in exchange
rates beneficially impacted the reported growth in total turnover as a result of a
stronger euro partly offset by a weaker yen.
Mobile telecommunications
Years ended 31 March Change
2003 2002
£m £m %
Service revenues:
– Voice 21,201 16,646 27
– Data 3,622 2,093 73
Subtotal 24,823 18,739 32
Equipment & other 2,719 2,003 36
Total mobile revenues 27,542 20,742 33
Mobile service revenue increased as a result of greater usage of voice services,
increased penetration of data products and services and the benefit of a full year’s
service revenues from Vodafone Japan. This was partially offset by both reductions in
interconnect rates in a number of the Group’s markets, mainly in Europe, and the
effect of increased competitive activity in certain key European markets by existing
competitors looking to attract market share and generate customer loyalty.
Voice services increased as the Group achieved a sustained improvement in ARPU in
many key markets in Europe, compared with the year ended 31 March 2002, as
benefits from the Group’s continued focus on high value customers led to increased
penetration of the contract customer segment and initiatives to stimulate usage,
including the launch of new and innovative products, were realised.
Another key driver of the growth in turnover and improved ARPU position was the
continued success of the Group’s data product and service offerings, in particular,
increased SMS usage in the Group’s controlled networks. During the period,
Vodafone live!™ and the Mobile Connect Card were launched in most of the Group’s
European markets.
The Group’s main markets of Germany, Italy, the UK and Japan, all experienced
increases in mobile data revenues, with SMS revenues continuing to be the principal
component of these revenue streams, except in Vodafone Japan where internet data
remained the principal component due to the high proportion of Vodafone Japan’s
customer base with internet-capable phones.
The mobile equipment and other turnover increase was largely attributable to the
volume of gross customer connections and upgrades in the 2003 financial year, the
effects of the reduction in handset subsidies, in line with the Group’s strategy, and the
full year impact of the acquisition of a controlling interest in Vodafone Japan.
Non-mobile businesses
Turnover from other operations, which comprised turnover relating to the Group’s
interests in its fixed line businesses in Japan (Japan Telecom) and Germany (Arcor),
and turnover from Vodafone Information Systems GmbH, a German IT and data
services business, increased from £2,103 million to £2,833 million. The increase was
primarily as a result of the full year inclusion of Japan Telecom following completion of
the Group’s acquisition of a controlling stake in October 2001.
Operating loss
After goodwill amortisation and exceptional items, the Group reported a total operating
loss of £5,451 million, compared with a loss of £11,834 million for the comparable
period. This net change of £6,383 million arose as a result of a £4,832 million
reduction in respect of exceptional items, and a £2,137 million increase in operating
profit, before goodwill amortisation and exceptional items, partly offset by a £586
million increase in the goodwill amortisation charge, which increased primarily as a
result of the acquisition of Vodafone Japan and Japan Telecom in the second half of
the 2002 financial year.
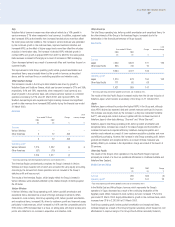
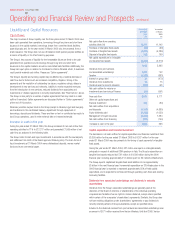
Expenses
Years ended 31 March
2003 2002
% of turnover % of turnover
Direct costs and operating expenses 63.1 64.8
Depreciation and amortisation 13.6 13.0
The Group’s direct costs consist primarily of financial incentives to service providers
and dealers, payments to landline and mobile operators for delivering calls outside the
Group’s networks and for providing landline or microwave links, depreciation of network
infrastructure, the cost of customer equipment sold and network operating costs.
Excluding Vodafone Japan, the Group’s equipment costs and cost of providing financial
incentives to service providers and dealers for acquiring and retaining customers
declined to 13.8% of turnover from mobile telecommunications, compared with
14.7% for the prior year, demonstrating the continued focus on gaining and retaining
high-value customers in the most cost-efficient manner. Inclusive of Vodafone Japan,
equipment costs and financial incentives amounted to 21.1% of turnover from mobile
telecommunications as costs to connect and retain customers, although reducing,
remained higher in Japan than in the Group’s other key markets.
Depreciation increased by £1,099 million for the year ended 31 March 2002 to
£3,979 million for the year ended 31 March 2003, primarily as a result of the full year
inclusion of Vodafone Japan and Japan Telecom. In Japan, depreciation also increased
as a result of a charge in respect of its UMTS network, which was opened for
commercial service in December 2002, and in Germany, depreciation increased as a
result of the prior year expenditure on network infrastructure improvements.
Goodwill amortisation
The charge for goodwill amortisation increased from £13,470 million for the year
ended 31 March 2002 to £14,056 million for the year ended 31 March 2003 as a
result of a full year’s charge for prior year acquisitions, charges in respect of current
year acquisitions and the impact of foreign exchange.
Exceptional operating items
Exceptional operating costs of £576 million for the year ended 31 March 2003
comprised impairment charges of £405 million and £80 million for the Group’s
interest in Japan Telecom and Grupo Iusacell, respectively, additional costs incurred as
a result of the integration of Vizzavi into the Group, following the acquisition of the
remaining 50% interest in August 2002, and related restructuring of the Group’s
Global mobile platform business.