Vodafone 2004 Annual Report Download - page 38
Download and view the complete annual report
Please find page 38 of the 2004 Vodafone annual report below. You can navigate through the pages in the report by either clicking on the pages listed below, or by using the keyword search tool below to find specific information within the annual report.-
 1
1 -
2
-
3
-
4
-
5
-
6
-
7
-
8
-
9
-
10
-
11
-
12
-
13
-
14
-
15
-
16
-
17
-
18
-
19
-
20
-
21
-
22
-
23
-
24
-
25
-
26
-
27
-
 28
28 -
 29
29 -
 30
30 -
 31
31 -
 32
32 -
 33
33 -
 34
34 -
 35
35 -
 36
36 -
 37
37 -
 38
38 -
 39
39 -
 40
40 -
 41
41 -
 42
42 -
 43
43 -
 44
44 -
 45
45 -
 46
46 -
 47
47 -
 48
48 -
49
-
50
-
51
-
52
-
53
-
54
-
55
-
56
-
57
-
58
-
59
-
60
-
61
-
62
-
63
-
64
-
65
-
66
-
67
-
68
-
69
-
70
-
71
-
72
-
73
-
74
-
75
-
76
-
77
-
78
-
79
-
80
-
81
-
82
-
83
-
84
-
85
-
86
-
87
-
88
-
89
-
90
-
91
-
92
-
93
-
94
-
95
-
96
-
97
-
98
-
99
-
100
-
101
-
102
-
103
-
104
-
105
-
106
-
107
-
108
-
109
-
110
-
111
-
112
-
113
-
114
-
115
-
116
-
117
-
118
-
119
-
120
-
121
-
122
-
123
-
124
-
125
-
126
-
127
-
128
-
129
-
130
-
131
-
132
-
133
-
134
-
135
-
136
-
137
-
138
-
139
-
140
-
141
-
142
 |
 |

Vodafone Group Plc Annual Report 2004
36
Operating and Financial Review and Prospects continued
2003 financial year compared to 2002 financial year
Mobile telecommunications
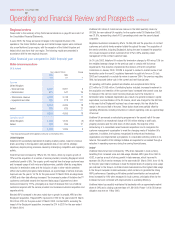
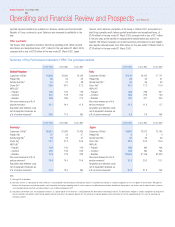
UK & Ireland
Years ended 31 March Change
2003 2002
£m £m %
Turnover
United Kingdom 4,026 3,763 7
Ireland 629 477 32
4,655 4,240 10
Operating profit*
United Kingdom 1,120 941 19
Ireland 206 113 82
1,326 1,054 26
* Total Group operating profit before goodwill amortisation and exceptional items
The UK & Ireland Region benefited from the first full year inclusion of Vodafone
Ireland, which became a subsidiary of the Group in May 2001.
United Kingdom
At 31 March 2003, Vodafone UK was, according to a quarterly review by Oftel, the
largest mobile network operator in terms of mobile service revenue share for outbound
calls, with a lead of seven percentage points over its nearest competitor.
During the period, Vodafone UK continued to focus on the acquisition of high value
customers and as such saw increases in its contract customer base. At 31 March
2003, Vodafone UK’s in-house service provider companies accounted for 57% of the
contract customer base, which includes 370,000 customers arising from the
acquisition of Cellular Operations Limited during the year.
Vodafone UK continued to invest in its network infrastructure to improve network
quality and maintain its position as the leading network, in terms of customer
satisfaction. Vodafone UK continues to be recognised in Oftel surveys as the leading
UK network, with a call success rate of 98.3%.
The revenue increase in Vodafone UK was as a result of a larger customer base and
improved customer mix, activity levels and ARPU.
The improvement in the proportion of contract customers was as a result of the
Group’s commercial policy to focus on high value customers. Customer activity levels
also improved reflecting the improved customer mix and increased usage. Contract
ARPU fell due to the continued migration of higher value prepaid customers to
contract tariffs. Despite this migration, ARPU for the prepaid customer base increased
due in part to the disconnection of inactive customers. Prepaid churn increased
partially due to the migration of prepaid customers onto contract tariffs.
Ireland
In Ireland, strong growth in data revenues resulted in data revenues representing
19.1% of service revenues for the year ended 31 March 2003 and have exceeded
20% of service revenues since December 2002. As a result of this growth in data
usage, and continued high levels of voice usage, ARPU in Ireland continued to be
amongst the highest in the Group’s European businesses.
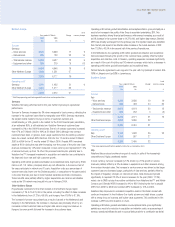
Northern Europe
Local
Years ended 31 March Change currency change
2003 2002
£m £m % %
Turnover
Germany 4,646 4,112 13 8
Other Northern Europe 1,531 1,257 22
6,177 5,369 15
Operating profit*
Germany 1,435 1,429 –(3)
Other Northern Europe 1,077 745 45
2,512 2,174 16
* Total Group operating profit before goodwill amortisation and exceptional items
Revenues for the Northern Europe Region comprise those in respect of the Group’s
subsidiaries in Germany, the Netherlands, Sweden and Hungary.
Germany
The turnover increase was driven by the improved mix in the customer base and
higher usage of both voice and data services.
Contract ARPU decreased as a result of higher contract penetration, including
customer migration from prepaid to contract tariffs. Prepaid ARPU increased reflecting
higher usage levels.
Total Group operating profit, before goodwill amortisation and exceptional items,
remained stable as the effect of the growth in turnover, as describe above, was almost
entirely offset by increased costs, predominantly due to higher acquisition costs, and a
higher depreciation charge as a consequence of the expenditure on network
infrastructure and IT system improvements in the 2002 financial year.
Other Northern Europe
The rest of the Northern Europe Region saw turnover increase due to an increased
customer base and an increase in data usage.
Total Group operating profit, before goodwill amortisation and exceptional items
benefited from the increase in the Group’s effective stake in SFR from 32.0% to
approximately 43.9% in January 2003.
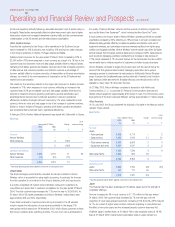
Southern Europe
Local
Years ended 31 March Change currency change
2003 2002
£m £m % %
Turnover
Italy 4,371 3,711 18 13
Other Southern Europe 3,680 3,032 21
8,051 6,743 19
Operating profit*
Italy 1,588 1,267 25 18
Other Southern Europe 907 805 13
2,495 2,072 20
* Total Group operating profit before goodwill amortisation and exceptional items