Vodafone 2004 Annual Report Download - page 36
Download and view the complete annual report
Please find page 36 of the 2004 Vodafone annual report below. You can navigate through the pages in the report by either clicking on the pages listed below, or by using the keyword search tool below to find specific information within the annual report.-
 1
1 -
2
-
3
-
4
-
5
-
6
-
7
-
8
-
9
-
10
-
11
-
12
-
13
-
14
-
15
-
16
-
17
-
18
-
19
-
20
-
21
-
22
-
23
-
24
-
25
-
 26
26 -
 27
27 -
 28
28 -
 29
29 -
 30
30 -
 31
31 -
 32
32 -
 33
33 -
 34
34 -
 35
35 -
 36
36 -
 37
37 -
 38
38 -
 39
39 -
 40
40 -
 41
41 -
 42
42 -
 43
43 -
 44
44 -
 45
45 -
 46
46 -
47
-
48
-
49
-
50
-
51
-
52
-
53
-
54
-
55
-
56
-
57
-
58
-
59
-
60
-
61
-
62
-
63
-
64
-
65
-
66
-
67
-
68
-
69
-
70
-
71
-
72
-
73
-
74
-
75
-
76
-
77
-
78
-
79
-
80
-
81
-
82
-
83
-
84
-
85
-
86
-
87
-
88
-
89
-
90
-
91
-
92
-
93
-
94
-
95
-
96
-
97
-
98
-
99
-
100
-
101
-
102
-
103
-
104
-
105
-
106
-
107
-
108
-
109
-
110
-
111
-
112
-
113
-
114
-
115
-
116
-
117
-
118
-
119
-
120
-
121
-
122
-
123
-
124
-
125
-
126
-
127
-
128
-
129
-
130
-
131
-
132
-
133
-
134
-
135
-
136
-
137
-
138
-
139
-
140
-
141
-
142
 |
 |

Vodafone Group Plc Annual Report 2004
34
Operating and Financial Review and Prospects continued
by the local regulatory authority following a favourable European Court of Justice ruling on
its legality. These factors were partially offset by higher interconnect costs, due to higher
interconnect volume and increased international roaming traffic and the commencement
of depreciation on the 3G network and the related licence amortisation.
Other Southern Europe
Proportionate customers for the Group’s other operations in the Southern Europe
region increased by 19% during the year, including 10% arising from stake changes
in the Group’s operations in Greece, Portugal, Albania and Malta.
Vodafone Spain’s turnover for the year ended 31 March 2004 increased by 22% to
£2,608 million (13% when measured in local currency) as a result of a 7% rise in the
customer base and improved voice and data usage, partially offset by reduced prices.
Operating profit before goodwill amortisation improved due to the increased proportion
of data revenue and reduced acquisition and retention costs as a percentage of
turnover, partially offset by a higher proportion of depreciation and licence amortisation
charges, as a result of the commencement of depreciation on the 3G network and
related licence amortisation.
The results for the remaining markets in the region also improved. In Greece, turnover
increased by 17%, when measured in local currency, reflecting an increase in the
customer base of 9% and increased voice and data usage, partially offset by price
reductions. Vodafone Greece’s operating profit before goodwill amortisation and
exceptional items improved due to reduced acquisition costs and operational
efficiencies. Vodafone Portugal’s turnover improved by 7%, when measured in local
currency, driven by voice and data usage on top of an increase in customer numbers.
Similar to Greece, Vodafone Portugal’s operating profit before goodwill amortisation
and exceptional items improved due to operational efficiencies.
In February 2004 a Partner Network Agreement was signed with Cytamobile in Cyprus.
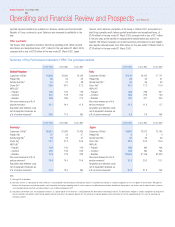
Americas
Local
Years ended 31 March Change currency change
2004 2003
£m £m % %
Turnover
Verizon Wireless ––––
Other Americas –5 (100)
–5 (100)
Operating profit/(loss)*
Verizon Wireless 1,406 1,270 11 20
Other Americas (13) (51) (75)
1,393 1,219 14
* Total Group operating profit before goodwill amortisation and exceptional items
United States
The Americas Region predominantly comprises the Group’s interests in Verizon
Wireless, which is accounted for using equity accounting. Accordingly, the turnover
from this operation is not included in the Group’s statutory profit and loss account.
In a highly competitive US market, Verizon Wireless continues to outperform its
competitors and ranked first in customer net additions for the year ended 31 March
2004. The total customer base increased by 17% over the year to 38,909,000. At
31 March 2004, US market penetration and Verizon Wireless’ market share were
approximately 56% and 24%, respectively.
Churn rates continued to improve and are among the lowest in the US wireless
industry despite the introduction of local number portability in the largest 100
metropolitan service areas from 24 November 2003, which allows customers to keep
their phone numbers when switching providers. The low churn rate is attributable to
the quality of Verizon Wireless’ network and the success of retention programmes
such as the Worry Free GuaranteeSM, which includes the New Every TwoSM plan.
In local currency, the Group’s share of Verizon Wireless’ operating profit before goodwill
amortisation increased by 20%, reflecting an 18% increase in turnover, increased cost
efficiencies being partially offset by increased acquisition and retention costs net of
equipment revenues, as a percentage of service revenues resulting from higher gross
additions and upgrade activities. Verizon Wireless’ turnover growth was driven by higher
service revenue from the larger customer base and an increase in ARPU. Data products,
such as picture messaging, positively contributed to an increase in data revenue of
172%, which represents 2.7% of service revenue for the current year. The rise in ARPU
was primarily due to a higher proportion of customers on higher access price plans.
Verizon Wireless continued to expand its product base, with the launch during the
period of the first graphics based instant messaging application and a picture
messaging service to complement its data products. Additionally, Verizon Wireless
began to expand its BroadbandAccess service nationally. Powered by its Evolution-
Data Optimized wide-area network, BroadbandAccess commercial service will be
available in many major US cities later this year.
On 23 May 2003, Verizon Wireless completed a transaction with Northcoast
Communications L.L.C., to purchase 50 Personal Communications licences and
related network assets for approximately $762 million in cash. The PCS licences cover
large portions of the East Coast and Midwest, serving approximately 47 million people.
Other Americas
On 29 July 2003, the Group completed the disposal of its stake in the Mexican mobile
operator Grupo Iusacell.
Asia Pacific
Local
Years ended 31 March Change currency change
2004 2003
£m £m % %
Turnover
Japan
– Voice services 4,788 4,776 – 2
– Data services 1,350 1,216 11 12
– Total service revenue 6,138 5,992 2 4
– Equipment and other 1,607 1,547 4 5
7,745 7,539 3 4
Other Asia Pacific 1,040 825 26
8,785 8,364 5
Operating profit*
Japan 1,045 1,310 (20) (20)
Other Asia Pacific 167 111 50
1,212 1,421 (15)
* Total Group operating profit before goodwill amortisation and exceptional items
Japan
This financial year has been challenging for Vodafone Japan due to the strength of
competitor offerings.
Turnover increased by 4% in local currency to £7,745 million for the year ended
31 March 2004. The customer base increased by 7% over the year, with the
proportion of lower value prepaid customers increasing to 9% from 6%. ARPU reduced
by 7%, as a result of higher value contract customers migrating to competitors and
the effect of new price plans and the increased prepaid customer base was felt.
Vodafone Japan’s market share, at 31 March 2004, was marginally lower, at 18.4%,
than at 31 March 2003. Overall mobile penetration levels in Japan remain low