Vodafone 2004 Annual Report Download - page 124
Download and view the complete annual report
Please find page 124 of the 2004 Vodafone annual report below. You can navigate through the pages in the report by either clicking on the pages listed below, or by using the keyword search tool below to find specific information within the annual report.-
 1
1 -
2
-
3
-
4
-
5
-
6
-
7
-
8
-
9
-
10
-
11
-
12
-
13
-
14
-
15
-
16
-
17
-
18
-
19
-
20
-
21
-
22
-
23
-
24
-
25
-
26
-
27
-
28
-
29
-
30
-
31
-
32
-
33
-
34
-
35
-
36
-
37
-
38
-
39
-
40
-
41
-
42
-
43
-
44
-
45
-
46
-
47
-
48
-
49
-
50
-
51
-
52
-
53
-
54
-
55
-
56
-
57
-
58
-
59
-
60
-
61
-
62
-
63
-
64
-
65
-
66
-
67
-
68
-
69
-
70
-
71
-
72
-
73
-
74
-
75
-
76
-
77
-
78
-
79
-
80
-
81
-
82
-
83
-
84
-
85
-
86
-
87
-
88
-
89
-
90
-
91
-
92
-
93
-
94
-
95
-
96
-
97
-
98
-
99
-
100
-
101
-
102
-
103
-
104
-
105
-
106
-
107
-
108
-
109
-
110
-
111
-
112
-
113
-
 114
114 -
 115
115 -
 116
116 -
 117
117 -
 118
118 -
 119
119 -
 120
120 -
 121
121 -
 122
122 -
 123
123 -
 124
124 -
 125
125 -
 126
126 -
 127
127 -
 128
128 -
 129
129 -
 130
130 -
 131
131 -
 132
132 -
 133
133 -
 134
134 -
135
-
136
-
137
-
138
-
139
-
140
-
141
-
142
 |
 |
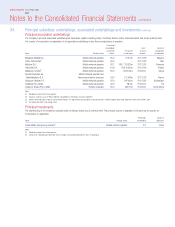
Associated undertakings
Summary aggregated financial information of the Group’s associated undertakings, extracted on a 100% basis from accounts prepared under UK GAAP to
31 March 2004, is set out below.
2004 2004 2004 2003
Equity-accounted Non-consolidated Equity-accounted Equity-accounted
entities as entity as entities as entities as
defined under defined under defined under defined under
UK GAAP US GAAP US GAAP US GAAP
£m £m £m £m
Assets
Current assets 6,048 4,522 10,570 9,370
Non-current assets 19,619 3,600 23,219 24,676
25,667 8,122 33,789 34,046
Liabilities and equity shareholders’ funds
Current liabilities 11,818 1,818 13,636 14,788
Long-term liabilities 5,076 – 5,076 5,310
Total equity shareholders’ funds 8,773 6,304 15,077 13,948
25,667 8,122 33,789 34,046
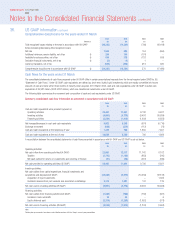
Turnover 23,418 5,276 28,694 27,519
Operating profit 6,759 2,494 9,253 7,298
Non-consolidated entity as defined under US GAAP comprise Vodafone Italy throughout the year, which has been consolidated under UK GAAP – see “Summary
of differences between UK GAAP and US GAAP – (a) Non-consolidated entities and investments accounted for under the equity method” on page 117.
Included in current liabilities and long-term liabilities are amounts owed to the Group, other shareholders of the associated companies and third parties. The
Group’s share of all associated companies’ net debt amounted to £3,714 million at 31 March 2004 (2003: £4,276 million).
Summary financial information for Verizon Wireless and Vodafone Italy for the three years ended 31 March 2004 is set out below. The financial information is
extracted on a 100% basis from accounts prepared under UK GAAP.
Verizon Wireless Vodafone Italy
2004 2003 2002 2004 2003 2002
£m £m £m £m £m £m
Assets
Current assets 2,142 2,257 3,728 4,522 2,337 1,805
Non-current assets 13,033 13,645 12,838 3,600 3,672 3,112
15,175 15,902 16,566 8,122 6,009 4,917
Liabilities and equity shareholders’ funds
Current liabilities 6,610 7,809 8,405 1,818 1,810 1,483
Long-term liabilities 3,910 3,605 4,772 –––
Total equity shareholders’ funds 4,655 4,488 3,389 6,304 4,199 3,434
15,175 15,902 16,566 8,122 6,009 4,917
Turnover 13,886 12,902 12,449 5,276 4,371 3,732
Operating profit 3,035 2,795 3,029 2,494 1,588 1,344
Vodafone Group Plc Annual Report 2004
122
Notes to the Consolidated Financial Statements continued
36. US GAAP information continued