Vodafone 2004 Annual Report Download - page 26
Download and view the complete annual report
Please find page 26 of the 2004 Vodafone annual report below. You can navigate through the pages in the report by either clicking on the pages listed below, or by using the keyword search tool below to find specific information within the annual report.-
 1
1 -
2
-
3
-
4
-
5
-
6
-
7
-
8
-
9
-
10
-
11
-
12
-
13
-
14
-
15
-
 16
16 -
 17
17 -
 18
18 -
 19
19 -
 20
20 -
 21
21 -
 22
22 -
 23
23 -
 24
24 -
 25
25 -
 26
26 -
 27
27 -
 28
28 -
 29
29 -
 30
30 -
 31
31 -
 32
32 -
 33
33 -
 34
34 -
 35
35 -
 36
36 -
37
-
38
-
39
-
40
-
41
-
42
-
43
-
44
-
45
-
46
-
47
-
48
-
49
-
50
-
51
-
52
-
53
-
54
-
55
-
56
-
57
-
58
-
59
-
60
-
61
-
62
-
63
-
64
-
65
-
66
-
67
-
68
-
69
-
70
-
71
-
72
-
73
-
74
-
75
-
76
-
77
-
78
-
79
-
80
-
81
-
82
-
83
-
84
-
85
-
86
-
87
-
88
-
89
-
90
-
91
-
92
-
93
-
94
-
95
-
96
-
97
-
98
-
99
-
100
-
101
-
102
-
103
-
104
-
105
-
106
-
107
-
108
-
109
-
110
-
111
-
112
-
113
-
114
-
115
-
116
-
117
-
118
-
119
-
120
-
121
-
122
-
123
-
124
-
125
-
126
-
127
-
128
-
129
-
130
-
131
-
132
-
133
-
134
-
135
-
136
-
137
-
138
-
139
-
140
-
141
-
142
 |
 |

Vodafone Group Plc Annual Report 2004
24
Operating and Financial Review and Prospects continued
movements by restating the current period’s results as if they had been generated at
the prior period’s exchange rates. Management believes that these measures provide
useful information to assist investors in assessing the Group’s operating performance
from period to period.
Foreign Currency Translation
The Company publishes its Consolidated Financial Statements in pounds sterling.
However, many of the Company’s subsidiary and associated undertakings report their
turnover, costs, assets and liabilities in currencies other than pounds sterling and the
Company translates the turnover, costs, assets and liabilities of those subsidiary and
associated undertakings into pounds sterling when preparing its Consolidated
Financial Statements. Consequently, fluctuations in the value of pounds sterling versus
other currencies could materially affect the amount of these items in the Consolidated
Financial Statements, even if their value has not changed in their original currency.
In this Annual Report, references to “US dollars”, “$”, “cents”or “¢” are to United
States currency and references to “pounds sterling”, “£”, “pence”or “p” are to UK
currency. References to “euros”or “a”are to the currency of the EU Member States
which have adopted the euro as their currency. Prior to 1 January 2002, the euro was
used only in “paperless”transactions. Euro banknotes and coins were issued on
1 January 2002. References to “yen”or “¥” are to the currency of Japan. Merely for
convenience, this Annual Report contains translations of certain pounds sterling, euro
and yen amounts into US dollars at specified rates. These translations should not be
construed as representations that the pounds sterling, euro or yen amounts actually
represent such US dollar amounts or could be converted into US dollars at the rate
indicated or at any other rate. Unless otherwise indicated, the translations of pounds
sterling and euro amounts into US dollars have been made at $1.8400 per £1.00,
$1.2292 per a1.00 and ¥104.18 per $1.00, the Noon Buying Rate in the City of New
York for cable transfers in pounds sterling, euro and yen amounts as certified for
customs purposes by the Federal Reserve Bank of New York (the “Noon Buying Rate”)
on 31 March 2004. The Noon Buying Rates on 24 May 2004 were $1.7908 per
£1.00, $1.1978 per a1.00 and ¥112.66 per $1.00.
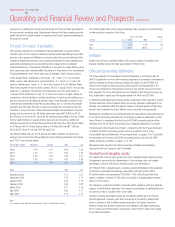
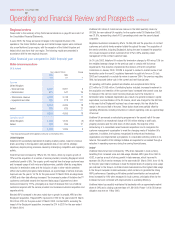
The following table sets out, for the periods and dates indicated, the period end,
average, high and low Noon Buying Rates for pounds sterling expressed in US dollars
per £1.00, to two decimal places.
Years ended 31 March Period end Average High Low
2000 1.59 1.61 1.68 1.55
2001 1.42 1.47 1.60 1.40
2002 1.42 1.43 1.48 1.37
2003 1.58 1.54 1.65 1.43
2004 1.84 1.69 1.90 1.55
Month High Low
November 2003 1.72 1.67
December 2003 1.78 1.72
January 2004 1.85 1.79
February 2004 1.90 1.82
March 2004 1.87 1.79
April 2004 1.86 1.77
May 2004(1) 1.79 1.75
Note:
(1) In respect of May 2004, for the period from 1 May to 24 May 2004, inclusive.
The following table sets out the average exchange rates compared to pounds sterling
of other principal currencies of the Group.
Years to 31 March Change
Currency 2004 2003 %
Euro 1.44 1.56 (8)
Yen 191.5 188.2 2
Inflation
Inflation has not had a significant effect on the Group’s results of operations and
financial condition during the three years ended 31 March 2004.
Critical Accounting Estimates
The Group prepares its Consolidated Financial Statements in accordance with UK
GAAP, the application of which often requires judgements to be made by management
when formulating the Group’s financial position and results. Under UK GAAP, the
directors are required to adopt those accounting policies most appropriate to the
Group’s circumstances for the purposes of giving a true and fair view and to review
them regularly. The Group also prepares a reconciliation of the Group’s revenues, net
loss, shareholders’ equity and total assets between UK GAAP and US GAAP.
In determining and applying accounting policies, judgement is often required in respect
of items where the choice of specific policy, accounting estimate or assumption to be
followed could materially affect the reported results or net asset position of the Group
should it later be determined that a different choice would be more appropriate.
Management considers the accounting estimates and assumptions discussed below to
be its critical accounting estimates and, accordingly, provides an explanation of each
below. Where it is considered that the Group’s US GAAP accounting policies differ
materially from the UK GAAP accounting policy, a separate explanation is provided.
The discussion below should also be read in conjunction with the Group’s disclosure
of material UK GAAP accounting policies, which is provided in note 2 to the
Consolidated Financial Statements, “Accounting policies”on pages 73 to 75 and with
the description of the Group’s US GAAP accounting policies and other US GAAP
related disclosures provided on pages 117 to 119.
Management has discussed its critical accounting estimates and associated
disclosures with the Company’s Audit Committee.
Goodwill and intangible assets
The relative size of the Group’s goodwill and other intangible assets makes a number
of judgements surrounding the determination of their carrying value, and related
amortisation, critical to the Group’s financial position and performance.
At 31 March 2004, intangible assets, including goodwill attributable to the acquisition
of interests in associated undertakings, amounted to £93,622 million (2003:
£108,085 million), and represented 70% (2003: 70%) of the Group’s total fixed
assets. In addition, a further £1,190 million of goodwill is charged against reserves
(2003: £1,190 million).
The charge for goodwill amortisation is included within operating profit as a separate
category of administrative expenses. The charge for amortisation of capitalised licence
and spectrum fees is included within cost of sales.
Goodwill, including associated charges for amortisation, affects all of the Group’s
reported segments. However, given that the majority of the current goodwill asset
arose in connection with the Mannesmann acquisition, the Group’s results for
Northern Europe and Southern Europe are most affected, individually representing
£8,147 million and £4,826 million, respectively, of the £15,207 million total charge
for goodwill amortisation.