Vodafone 2004 Annual Report Download - page 4
Download and view the complete annual report
Please find page 4 of the 2004 Vodafone annual report below. You can navigate through the pages in the report by either clicking on the pages listed below, or by using the keyword search tool below to find specific information within the annual report.-
 1
1 -
 2
2 -
 3
3 -
 4
4 -
 5
5 -
 6
6 -
 7
7 -
 8
8 -
 9
9 -
 10
10 -
 11
11 -
 12
12 -
 13
13 -
 14
14 -
 15
15 -
16
-
17
-
18
-
19
-
20
-
21
-
22
-
23
-
24
-
25
-
26
-
27
-
28
-
29
-
30
-
31
-
32
-
33
-
34
-
35
-
36
-
37
-
38
-
39
-
40
-
41
-
42
-
43
-
44
-
45
-
46
-
47
-
48
-
49
-
50
-
51
-
52
-
53
-
54
-
55
-
56
-
57
-
58
-
59
-
60
-
61
-
62
-
63
-
64
-
65
-
66
-
67
-
68
-
69
-
70
-
71
-
72
-
73
-
74
-
75
-
76
-
77
-
78
-
79
-
80
-
81
-
82
-
83
-
84
-
85
-
86
-
87
-
88
-
89
-
90
-
91
-
92
-
93
-
94
-
95
-
96
-
97
-
98
-
99
-
100
-
101
-
102
-
103
-
104
-
105
-
106
-
107
-
108
-
109
-
110
-
111
-
112
-
113
-
114
-
115
-
116
-
117
-
118
-
119
-
120
-
121
-
122
-
123
-
124
-
125
-
126
-
127
-
128
-
129
-
130
-
131
-
132
-
133
-
134
-
135
-
136
-
137
-
138
-
139
-
140
-
141
-
142
 |
 |

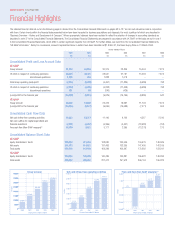
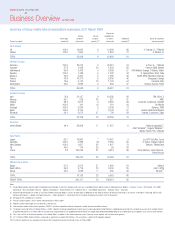
The selected financial data set out on the following pages is derived from the Consolidated Financial Statements on pages 68 to 127 and as such should be read in conjunction
with them. Certain trends within the financial data presented below have been impacted by business acquisitions and disposals, the most significant of which are described in
“Business Overview – History and Development of Company”. Where appropriate, balances have been restated to reflect the adoption of changes in accounting standards as
described in note 37 to the Consolidated Financial Statements. The Consolidated Financial Statements are prepared in accordance with UK GAAP, on the basis set out in note 1
to the Consolidated Financial Statements, which differ in certain significant respects from US GAAP. For further details, see note 36 to the Consolidated Financial Statements,
“US GAAP information”. Solely for convenience, amounts represented below in dollars have been translated at $1.8400: £1, the Noon Buying Rate on 31 March 2004.
At/year ended 31 March
2004 2004 2003 2002 2001 2000
$m £m £m £m £m £m
Consolidated Profit and Loss Account Data
UK GAAP
Group turnover 61,749 33,559 30,375 22,845 15,004 7,873
Of which in respect of: continuing operations 60,244 32,741 28,547 21,767 15,004 7,873
discontinued operations 1,505 818 1,828 1,078 – –
Total Group operating (loss)/profit (7,783) (4,230) (5,451) (11,834) (6,989) 798
Of which in respect of: continuing operations (7,904) (4,296) (5,208) (11,408) (6,989) 798
discontinued operations 121 66 (243) (426) – –
(Loss)/profit for the financial year (16,588) (9,015) (9,819) (16,155) (9,885) 542
US GAAP
Group turnover 50,882 27,653 22,416 16,561 11,103 7,873
(Loss)/profit for the financial year (14,954) (8,127) (9,055) (16,688) (7,071) 553
Consolidated Cash Flow Data
Net cash inflow from operating activities 22,663 12,317 11,142 8,102 4,587 2,510
Net cash outflow for capital expenditure and
financial investment (7,851) (4,267) (5,359) (4,441) (18,988) (752)
Free cash flow (Non-GAAP measure)(1) 15,679 8,521 5,171 2,365 (13,278) 276
Consolidated Balance Sheet Data
UK GAAP
Equity shareholders’ funds 205,940 111,924 128,630 130,540 144,979 140,589
Net assets 211,473 114,931 131,493 133,395 147,400 142,109
Total assets 270,718 147,129 163,239 162,867 172,362 153,541
US GAAP
Equity shareholders’ funds 230,053 125,029 140,436 140,887 155,522 146,334
Total assets 368,462 200,251 221,412 197,913 206,753 165,323
Vodafone Group Plc Annual Report 2004
2
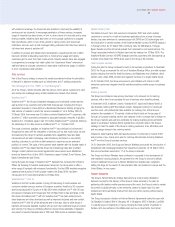
Financial Highlights
Financial
y
ear ended 31 March
00
5,0005,000
10,00010,000
15,00015,000
20,00020,000
25,00025,000
30,00030,000
35,00035,000
40,00040,000
20042003200220012000
£7,873
£15,004
£22,845
£30,375
£33,559
£ millions
Financial year ended 31 March
0
2,000
4,000
6,000
8,000
10,000
12,000
14,000
20042003200220012000
£2,510
£4,587
£8,102
£11,142
£12,317
£ millions
Financial year ended 31 March
20042003200220012000
£276
£(13,278)
£2,365
£5,171
£8,521
£ millions
(15,000)
(10,000)
(5,000)
0
5,000
10,000
Group turnover Net cash inflow from operating activities Free cash flow (Non-GAAP measure)(1)