Vodafone 2004 Annual Report Download - page 30
Download and view the complete annual report
Please find page 30 of the 2004 Vodafone annual report below. You can navigate through the pages in the report by either clicking on the pages listed below, or by using the keyword search tool below to find specific information within the annual report.-
 1
1 -
2
-
3
-
4
-
5
-
6
-
7
-
8
-
9
-
10
-
11
-
12
-
13
-
14
-
15
-
16
-
17
-
18
-
19
-
 20
20 -
 21
21 -
 22
22 -
 23
23 -
 24
24 -
 25
25 -
 26
26 -
 27
27 -
 28
28 -
 29
29 -
 30
30 -
 31
31 -
 32
32 -
 33
33 -
 34
34 -
 35
35 -
 36
36 -
 37
37 -
 38
38 -
 39
39 -
 40
40 -
41
-
42
-
43
-
44
-
45
-
46
-
47
-
48
-
49
-
50
-
51
-
52
-
53
-
54
-
55
-
56
-
57
-
58
-
59
-
60
-
61
-
62
-
63
-
64
-
65
-
66
-
67
-
68
-
69
-
70
-
71
-
72
-
73
-
74
-
75
-
76
-
77
-
78
-
79
-
80
-
81
-
82
-
83
-
84
-
85
-
86
-
87
-
88
-
89
-
90
-
91
-
92
-
93
-
94
-
95
-
96
-
97
-
98
-
99
-
100
-
101
-
102
-
103
-
104
-
105
-
106
-
107
-
108
-
109
-
110
-
111
-
112
-
113
-
114
-
115
-
116
-
117
-
118
-
119
-
120
-
121
-
122
-
123
-
124
-
125
-
126
-
127
-
128
-
129
-
130
-
131
-
132
-
133
-
134
-
135
-
136
-
137
-
138
-
139
-
140
-
141
-
142
 |
 |
Vodafone Group Plc Annual Report 2004
28
Operating and Financial Review and Prospects continued
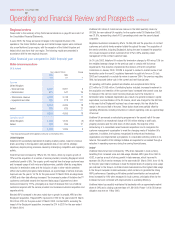
Operating Results
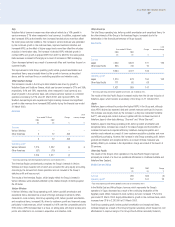
Group overview
Years ended 31 March
2004 2003 2002
£m £m £m
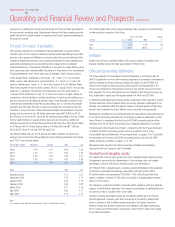
Turnover 33,559 30,375 22,845
Direct costs and operating expenses(1) (20,919) (19,158) (14,814)
Depreciation and amortisation(1)(2) (4,549) (4,141) (2,960)
Share of profit in joint ventures and associated undertakings(1) 2,658 2,105 1,973
10,749 9,181 7,044
Goodwill amortisation (15,207) (14,056) (13,470)
Exceptional operating items 228 (576) (5,408)
Total Group operating loss (4,230) (5,451) (11,834)
Exceptional non-operating items (103) (5) (860)
Net interest expense (714) (752) (845)
Taxation (3,154) (2,956) (2,140)
Loss on ordinary activities after taxation (8,201) (9,164) (15,679)
Loss for the financial year (9,015) (9,819) (16,155)
Notes:
(1) before goodwill amortisation and exceptional operating items
(2) includes loss on disposal of tangible fixed assets
2004 financial year compared to 2003 financial year
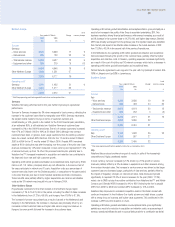
Turnover
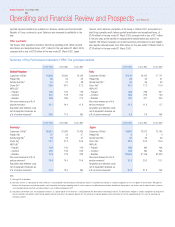
Turnover increased 10% in the 2004 financial year, as analysed below:
Mobile Non-mobile Group
%%%
Impact of
– Organic growth 10 5 10
– Foreign exchange 494
– Acquisitions & disposals 1 (49) (4)
Reported growth 15 (35) 10
The impact of acquisitions and disposals resulted mainly from the disposal of Japan
Telecom. The foreign exchange impact primarily arose due to a stronger Euro.
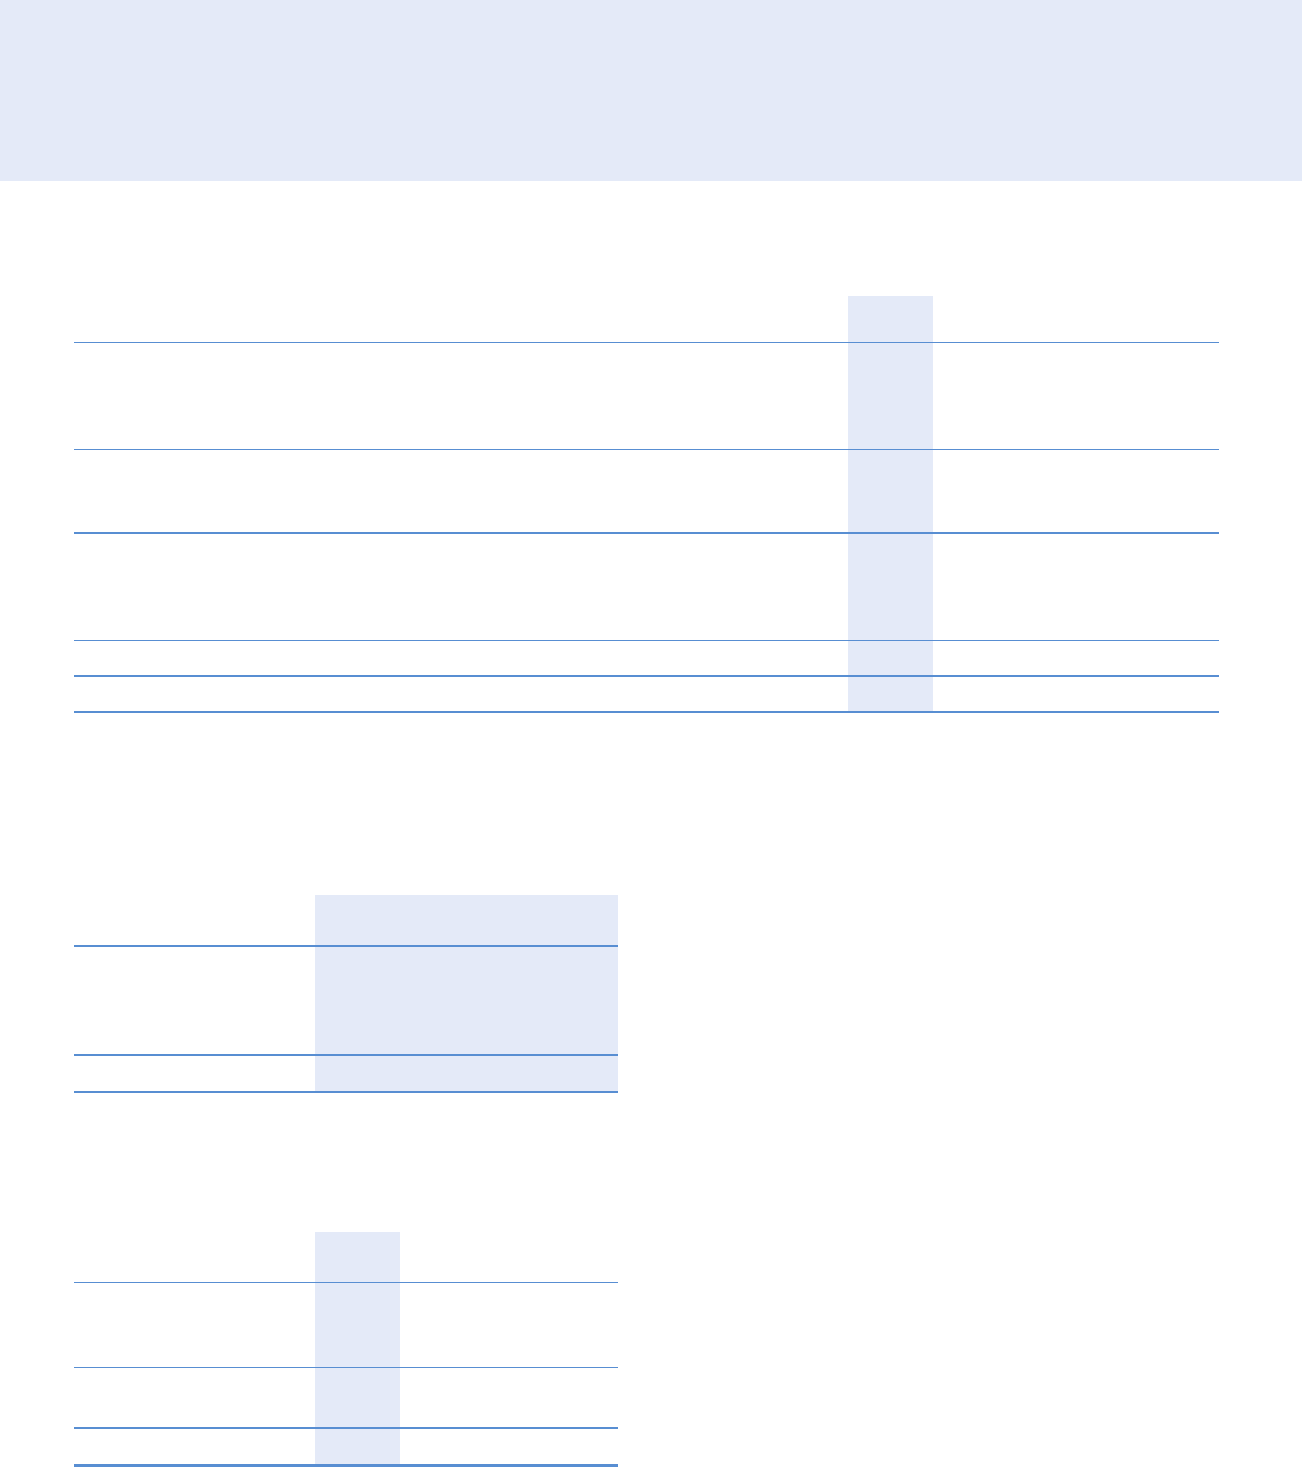
Mobile telecommunications
Years ended 31 March Change
2004 2003
£m £m %
Service revenues:
– Voice 23,618 21,201 11
– Data 4,540 3,622 25
Subtotal 28,158 24,823 13
Equipment & other 3,557 2,719 31
Total mobile revenues 31,715 27,542 15
The principal component of the increase in turnover from mobile telecommunications
arose from service revenue growth of 13%, driven primarily by growth in the Group’s
controlled customer base, which increased by 9% over the prior year.
ARPU was up 4% in Italy and 8% in the UK and down 7% and 1% in Japan and
Germany, respectively, compared with the year ended 31 March 2003. Total outgoing
voice usage in controlled mobile businesses increased by 11% over the year to 154.8
billion minutes for the year ended 31 March 2004, although the effect on ARPU was
partially offset by tariff reductions and regulatory intervention. Lower termination rates,
resulting from regulatory changes, have reduced service revenue by an estimated
£0.3 billion in the year.
Another key driver of the growth in service revenue was the continued success of the
Group’s data product and service offerings. Revenues from data services increased
25% to £4,540 million for the year ended 31 March 2004 and represented 16.1% of
service revenues in the Group’s controlled mobile subsidiaries for the twelve months
ended 31 March 2004, compared with 14.6% for the 2003 financial year. SMS
revenues continue to represent the largest component of both the level of and growth
in data revenues. Non-messaging data revenues increased to 4.2% of service
revenues from 3.6% in the prior financial year as a result of the increased focus on
providing value-added services, particularly through Vodafone live!™, the Group’s
business offerings and the increased penetration of data services into the Group’s
customer base.
Mobile equipment and other turnover increased 31% to £3,557 million, due to
revenues from non-Vodafone customers acquired as a result of the acquisition of
service providers in the UK and increased acquisition and retention activity. Excluding
these revenues, mobile equipment and other turnover increased slightly as a result of
higher gross connections and upgrades.
Non-mobile businesses
Turnover from other operations decreased by 35% to £1,844 million in the year,
principally as a result of the deconsolidation of Japan Telecom from 1 October 2003,
and the disposal of the Telematik business by Arcor in the previous year.
Operating loss
After goodwill amortisation and exceptional items, the Group reported a total operating
loss of £4,230 million, compared with a loss of £5,451 million for the previous year.
The £1,221 million reduction in the total operating loss arose as a result of a £228
million credit in respect of exceptional operating items in the year ended 31 March