Vodafone 2004 Annual Report Download - page 71
Download and view the complete annual report
Please find page 71 of the 2004 Vodafone annual report below. You can navigate through the pages in the report by either clicking on the pages listed below, or by using the keyword search tool below to find specific information within the annual report.-
 1
1 -
2
-
3
-
4
-
5
-
6
-
7
-
8
-
9
-
10
-
11
-
12
-
13
-
14
-
15
-
16
-
17
-
18
-
19
-
20
-
21
-
22
-
23
-
24
-
25
-
26
-
27
-
28
-
29
-
30
-
31
-
32
-
33
-
34
-
35
-
36
-
37
-
38
-
39
-
40
-
41
-
42
-
43
-
44
-
45
-
46
-
47
-
48
-
49
-
50
-
51
-
52
-
53
-
54
-
55
-
56
-
57
-
58
-
59
-
60
-
 61
61 -
 62
62 -
 63
63 -
 64
64 -
 65
65 -
 66
66 -
 67
67 -
 68
68 -
 69
69 -
 70
70 -
 71
71 -
 72
72 -
 73
73 -
 74
74 -
 75
75 -
 76
76 -
 77
77 -
 78
78 -
 79
79 -
 80
80 -
 81
81 -
82
-
83
-
84
-
85
-
86
-
87
-
88
-
89
-
90
-
91
-
92
-
93
-
94
-
95
-
96
-
97
-
98
-
99
-
100
-
101
-
102
-
103
-
104
-
105
-
106
-
107
-
108
-
109
-
110
-
111
-
112
-
113
-
114
-
115
-
116
-
117
-
118
-
119
-
120
-
121
-
122
-
123
-
124
-
125
-
126
-
127
-
128
-
129
-
130
-
131
-
132
-
133
-
134
-
135
-
136
-
137
-
138
-
139
-
140
-
141
-
142
 |
 |

Annual Report 2004 Vodafone Group Plc
69
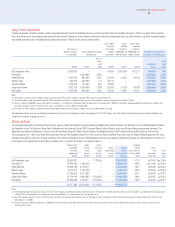
For the years ended 31 March
2004 2004 2003 2002
Note $m £m £m £m
Total Group turnover: Group and share of joint ventures and
associated undertakings
–Continuing operations 78,973 42,920 37,324 32,125
–Discontinued operations 1,505 818 1,828 1,416
80,478 43,738 39,152 33,541
Less: Share of joint ventures ––(8) (3)
Share of associated undertakings (18,729) (10,179) (8,769) (10,693)
Group turnover 3 61,749 33,559 30,375 22,845
Group turnover 3
–Continuing operations 60,244 32,741 28,547 21,767
–Discontinued operations 1,505 818 1,828 1,078
61,749 33,559 30,375 22,845
Operating (loss)/profit 3, 4, 5
–Continuing operations (8,909) (4,842) (5,052) (9,966)
–Discontinued operations 121 66 (243) (411)
(8,788) (4,776) (5,295) (10,377)
Share of operating profit/(loss) in joint ventures and associated undertakings 1,005 546 (156) (1,457)
Total Group operating loss
Group and share of joint ventures and associated undertakings 3 (7,783) (4,230) (5,451) (11,834)
Exceptional non-operating items 6 (190) (103) (5) (860)
–Continuing operations (81) (44) 20 (860)
–Discontinued operations (109) (59) (25) –
Loss on ordinary activities before interest 3 (7,973) (4,333) (5,456) (12,694)
Net interest payable and similar items 7 (1,314) (714) (752) (845)
Group (918) (499) (457) (503)
Share of joint ventures and associated undertakings (396) (215) (295) (342)
Loss on ordinary activities before taxation (9,287) (5,047) (6,208) (13,539)
Tax on loss on ordinary activities 8 (5,803) (3,154) (2,956) (2,140)
Group (5,273) (2,866) (2,624) (1,925)
Share of joint ventures and associated undertakings (530) (288) (332) (215)
Loss on ordinary activities after taxation (15,090) (8,201) (9,164) (15,679)
Equity minority interests (1,386) (753) (593) (415)
Non-equity minority interests (112) (61) (62) (61)
Loss for the financial year (16,588) (9,015) (9,819) (16,155)
Equity dividends 9 (2,535) (1,378) (1,154) (1,025)
Retained loss for the Group and its share of joint ventures and
associated undertakings 23 (19,123) (10,393) (10,973) (17,180)
Basic and diluted loss per share 10 (24.36)¢ (13.24)p (14.41)p (23.77)p
The accompanying notes are an integral part of these Consolidated Financial Statements.
The unaudited US dollar amounts are prepared on the basis set out in note 1.
Consolidated Profit and Loss Accounts