Vodafone 2004 Annual Report Download - page 39
Download and view the complete annual report
Please find page 39 of the 2004 Vodafone annual report below. You can navigate through the pages in the report by either clicking on the pages listed below, or by using the keyword search tool below to find specific information within the annual report.-
 1
1 -
2
-
3
-
4
-
5
-
6
-
7
-
8
-
9
-
10
-
11
-
12
-
13
-
14
-
15
-
16
-
17
-
18
-
19
-
20
-
21
-
22
-
23
-
24
-
25
-
26
-
27
-
28
-
 29
29 -
 30
30 -
 31
31 -
 32
32 -
 33
33 -
 34
34 -
 35
35 -
 36
36 -
 37
37 -
 38
38 -
 39
39 -
 40
40 -
 41
41 -
 42
42 -
 43
43 -
 44
44 -
 45
45 -
 46
46 -
 47
47 -
 48
48 -
 49
49 -
50
-
51
-
52
-
53
-
54
-
55
-
56
-
57
-
58
-
59
-
60
-
61
-
62
-
63
-
64
-
65
-
66
-
67
-
68
-
69
-
70
-
71
-
72
-
73
-
74
-
75
-
76
-
77
-
78
-
79
-
80
-
81
-
82
-
83
-
84
-
85
-
86
-
87
-
88
-
89
-
90
-
91
-
92
-
93
-
94
-
95
-
96
-
97
-
98
-
99
-
100
-
101
-
102
-
103
-
104
-
105
-
106
-
107
-
108
-
109
-
110
-
111
-
112
-
113
-
114
-
115
-
116
-
117
-
118
-
119
-
120
-
121
-
122
-
123
-
124
-
125
-
126
-
127
-
128
-
129
-
130
-
131
-
132
-
133
-
134
-
135
-
136
-
137
-
138
-
139
-
140
-
141
-
142
 |
 |

Annual Report 2004 Vodafone Group Plc
37
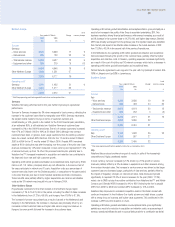
Italy
Vodafone Italy’s turnover increase was driven almost entirely by a 16% growth in
service revenues (11% when measured in local currency). In addition, equipment sales
also increased 36% as the benefits from increased handset prices more than offset
the lower gross customer additions. The increase in service revenues was generated
by the continued growth in the customer base, improved customer retention and
increased ARPU, as the effect of higher usage levels more than offset the voluntary
reduction in termination rates. The increase in blended ARPU reflected growth in
contract ARPU and growth in prepaid ARPU from 1297 to 1298 for the same period.
Data revenues increased 50% largely as a result of increases in SMS messaging.
Churn decreased primarily as a result of commercial offers and incentives focused on
customer loyalty.
The improvement in total Group operating profit, before goodwill amortisation and
exceptional items, was principally driven by the growth in turnover, as described
above, and the continued focus on controlling acquisition and retention costs.
Other Southern Europe
The increase in results in the Group’s other interests was driven by growth in
Vodafone Spain and Vodafone Greece, which saw turnover increase by 21% and 35%,
respectively, (16% and 29%, respectively, when measured in local currency) as a
result of growth in the customer base, with venture customer numbers in controlled
operations increasing by 15% since 31 March 2002, and improved ARPU. The
Southern Europe Region also experienced higher roaming revenues and significant
growth in data revenues from increased SMS activity during the financial year ended
31 March 2003.
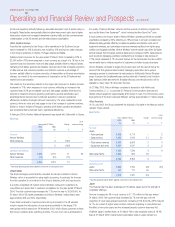
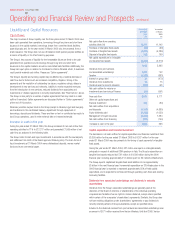
Americas
Local
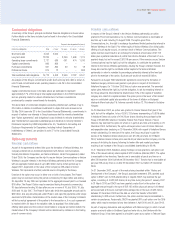
Years ended 31 March Change currency change
2003 2002
£m £m % %
Turnover
Verizon Wireless ––––
Other Americas 5 12 (58)
5 12 (58)
Operating profit*
Verizon Wireless 1,270 1,332 (5) 5
Other Americas (51) (15) –
1,219 1,317 (7)
* Total Group operating profit before goodwill amortisation and exceptional items
The Americas Region predominantly comprises the Group’s interests in Verizon
Wireless and Grupo Iusacell, both of which are accounted for using equity accounting.
Accordingly, the turnover from these operations are not included in the Group’s
statutory profit and loss account.
The results of the Americas Region, which largely reflect the Group’s interest in
Verizon Wireless, were adversely affected by the relative strength of sterling against
the US dollar.
Verizon Wireless
In Verizon Wireless, total Group operating profit, before goodwill amortisation and
exceptional items, decreased as a result of foreign exchange movements. When
measured in local currency, total Group operating profit, before goodwill amortisation
and exceptional items, increased 5%, driven by customer growth and improved usage,
particularly in data revenues, which increased by 106% over the comparable period to
£136 million. ARPU increased due to a focus on selling plans with higher access price
points, also reflected in an increase in acquisition and retention costs.
Other Americas
The total Group operating loss, before goodwill amortisation and exceptional items, for
the other interests of the Group in the Americas Region, increased due to the
deterioration in the financial performance of Grupo Iusacell.
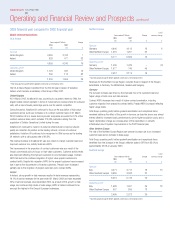
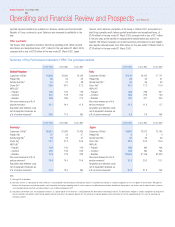
Asia Pacific
Local
Years ended 31 March Change currency change
2003 2002
£m £m % %
Turnover
Japan 7,539 3,323 127 132
Other Asia Pacific 825 749 10
8,364 4,072 105
Operating profit*
Japan 1,310 523 150 152
Other Asia Pacific 111 66 68
1,421 589 141
* Total Group operating profit before goodwill amortisation and exceptional items
The results of the Asia Pacific Region increased mainly from the full year inclusion of
Vodafone Japan, which became a subsidiary of the Group on 11 October 2001.
Japan
Vodafone Japan continued to produce the highest ARPU in the Group and, although
voice ARPU declined as expected, data and content revenues continued to improve.
This increase was largely driven by the increase in J-Sky (now rebranded Vodafone
live!™) web usage and content revenue, together with the continued success of
Vodafone Japan’s other data offerings, “Sha-mail”and “Movie Sha-mail”.
Vodafone Japan’s total Group operating profit, before goodwill amortisation and
exceptional items, increased as a result of the stake changes and the benefits of
increased turnover and corporate efficiency initiatives. Average acquisition and
retention costs reduced as a result of lower customer acquisition subsidies and more
cost efficient purchasing. However, the increase in total Group operating profit, before
goodwill amortisation and exceptional items, as a result of these measures was
partially offset by an increase in the depreciation charge as a result of the launch of
3G services.
Other Asia Pacific
The results of the Group’s other operations in the Asia Pacific Region improved
principally as a result of a focus on operational efficiencies in Vodafone Australia and
Vodafone New Zealand.
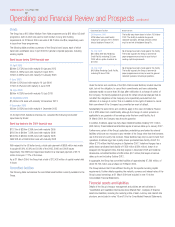
Middle East and Africa
2003 2002 Change
£m £m %
Turnover 290 306 (5)
Operating profit* 197 161 22
* Total Group operating profit before goodwill amortisation and exceptional items
In the Middle East and Africa Region, turnover, which represents the Group’s
operations in Egypt, decreased as a result of the continuing devaluation of the
Egyptian pound. When measured in local currency, turnover increased 17% for the
year ended 31 March 2003, largely attributable to growth in the customer base, which
increased over 31% to 2,263,000 at 31 March 2003.
Total Group operating profit, before goodwill amortisation and exceptional items,
increased largely as a result of the Group’s Egyptian subsidiary, which focused on cost
effectiveness to improve margins. The Group’s South African associate, Vodacom,