Vodafone 2004 Annual Report Download - page 47
Download and view the complete annual report
Please find page 47 of the 2004 Vodafone annual report below. You can navigate through the pages in the report by either clicking on the pages listed below, or by using the keyword search tool below to find specific information within the annual report.-
 1
1 -
2
-
3
-
4
-
5
-
6
-
7
-
8
-
9
-
10
-
11
-
12
-
13
-
14
-
15
-
16
-
17
-
18
-
19
-
20
-
21
-
22
-
23
-
24
-
25
-
26
-
27
-
28
-
29
-
30
-
31
-
32
-
33
-
34
-
35
-
36
-
 37
37 -
 38
38 -
 39
39 -
 40
40 -
 41
41 -
 42
42 -
 43
43 -
 44
44 -
 45
45 -
 46
46 -
 47
47 -
 48
48 -
 49
49 -
 50
50 -
 51
51 -
 52
52 -
 53
53 -
 54
54 -
 55
55 -
 56
56 -
 57
57 -
58
-
59
-
60
-
61
-
62
-
63
-
64
-
65
-
66
-
67
-
68
-
69
-
70
-
71
-
72
-
73
-
74
-
75
-
76
-
77
-
78
-
79
-
80
-
81
-
82
-
83
-
84
-
85
-
86
-
87
-
88
-
89
-
90
-
91
-
92
-
93
-
94
-
95
-
96
-
97
-
98
-
99
-
100
-
101
-
102
-
103
-
104
-
105
-
106
-
107
-
108
-
109
-
110
-
111
-
112
-
113
-
114
-
115
-
116
-
117
-
118
-
119
-
120
-
121
-
122
-
123
-
124
-
125
-
126
-
127
-
128
-
129
-
130
-
131
-
132
-
133
-
134
-
135
-
136
-
137
-
138
-
139
-
140
-
141
-
142
 |
 |

Annual Report 2004 Vodafone Group Plc
45
Outlook
For the year ending 31 March 2005
In the coming year, on an organic basis, the Group anticipates high single-digit
average proportionate mobile customer growth, leading to growth in Group turnover in
the 2005 financial year compared to the 2004 financial year.
The ongoing impact of the commercial launch of 3G services is expected to increase
depreciation and amortisation by around £0.6 billion in the 2005 financial year.
Factors that may affect the Group’s future tax charge include the absence of one-off
restructuring benefits, the resolution of open issues, future planning opportunities,
corporate acquisitions and disposals, and changes in tax legislation and rates.
For the 2005 financial year, total capitalised fixed asset additions are expected to be
around £5 billion, slightly higher than the £4.8 billion for the year ended 31 March
2004, mainly due to deferred investment from that year.
Free cash flow is expected to be around £7 billion, lower than in the 2004 financial
year, due to:
– the inclusion in that year of:
• £0.6 billion of one-off receipts from hedging instruments; and
• £0.2 billion of free cash flow from the fixed line business in Japan which has
been sold,
– together with higher cash expenditure expected in the 2005 financial year on:
•approximately £1 billion of additional capital expenditure, mainly due to the
unwinding of capital creditors; and
•tax payments, which are expected to be under £2 billion.
In presenting and discussing the Group’s reported results, free cash flow is calculated and presented on the basis of methodologies other than in accordance with UK GAAP.
The Group believes that it is both useful and necessary to communicate this non-GAAP measure to investors and other interested parties, for the following reasons:
–this statement allows the Company and external parties to evaluate the Group’s liquidity and the cash generated by the Group’s operations. Free cash flow does not include
cash flows relating to acquisitions and disposals or financing activities and so reflects the cash available for such activities, to strengthen the balance sheet or to provide
returns to shareholders in the form of dividends or share repurchases;
–it facilitates comparability of results with other companies; and,
– it is useful in connection with discussion with the investment analyst community and the debt rating agencies.
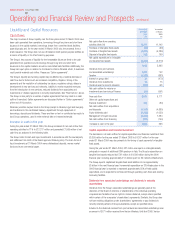
A reconciliation of net cash flow inflow from operating activities, the closest equivalent GAAP measure, to free cash flow, is shown below:
Years ended 31 March
2004 2003 2002 2001 2000
£m £m £m £m £m
Net cash inflow from operating activities 12,317 11,142 8,102 4,587 2,510
Purchase of intangible fixed assets (21) (99) (325) (13,163) (185)
Purchase of tangible fixed assets (4,508) (5,289) (4,145) (3,698) (1,848)
Disposal of tangible fixed assets 158 109 75 275 294
Dividends received from joint ventures and associated undertakings 1,801 742 139 353 236
Taxation (1,182) (883) (545) (1,585) (325)
Net cash outflow for returns on investments and servicing of finance (44) (551) (936) (47) (406)
Free cash flow 8,521 5,171 2,365 (13,278) 276
Non-GAAP Information