Vodafone 2004 Annual Report Download - page 94
Download and view the complete annual report
Please find page 94 of the 2004 Vodafone annual report below. You can navigate through the pages in the report by either clicking on the pages listed below, or by using the keyword search tool below to find specific information within the annual report.-
 1
1 -
2
-
3
-
4
-
5
-
6
-
7
-
8
-
9
-
10
-
11
-
12
-
13
-
14
-
15
-
16
-
17
-
18
-
19
-
20
-
21
-
22
-
23
-
24
-
25
-
26
-
27
-
28
-
29
-
30
-
31
-
32
-
33
-
34
-
35
-
36
-
37
-
38
-
39
-
40
-
41
-
42
-
43
-
44
-
45
-
46
-
47
-
48
-
49
-
50
-
51
-
52
-
53
-
54
-
55
-
56
-
57
-
58
-
59
-
60
-
61
-
62
-
63
-
64
-
65
-
66
-
67
-
68
-
69
-
70
-
71
-
72
-
73
-
74
-
75
-
76
-
77
-
78
-
79
-
80
-
81
-
82
-
83
-
 84
84 -
 85
85 -
 86
86 -
 87
87 -
 88
88 -
 89
89 -
 90
90 -
 91
91 -
 92
92 -
 93
93 -
 94
94 -
 95
95 -
 96
96 -
 97
97 -
 98
98 -
 99
99 -
 100
100 -
 101
101 -
 102
102 -
 103
103 -
 104
104 -
105
-
106
-
107
-
108
-
109
-
110
-
111
-
112
-
113
-
114
-
115
-
116
-
117
-
118
-
119
-
120
-
121
-
122
-
123
-
124
-
125
-
126
-
127
-
128
-
129
-
130
-
131
-
132
-
133
-
134
-
135
-
136
-
137
-
138
-
139
-
140
-
141
-
142
 |
 |

Vodafone Group Plc Annual Report 2004
92
Notes to the Consolidated Financial Statements continued
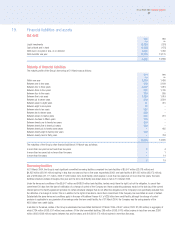
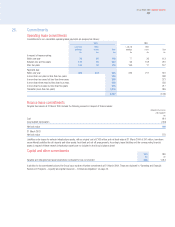
Financial liabilities and assets
The Group uses short term foreign exchange instruments for managing both liquidity and the currency mix of Group net debt. The following table shows the
impact of current foreign exchange instruments on the currency profile of the Group’s net debt. Certain of the foreign exchange instruments disclosed in the
table hedge items other than borrowings. Short term debtors and creditors are not included in the analysis in notes 19 and 20.
Interest rate and currency of financial liabilities
Non-interest
bearing
Fixed rate financial financial
Financial liabilities liabilities
liabilities net Non-interest Weighted Weighted
Gross Foreign of foreign Floating rate Fixed rate bearing Weighted average time average
financial exchange exchange financial financial financial average for which period until
liabilities instruments instruments liabilities liabilities liabilities interest rate rate is fixed maturity
Currency £m £m £m £m £m £m % Years Years
At 31 March 2004:
Sterling 1,110 (2,456) (1,346) (1,346) –––––
Euro 5,670 1,553 7,223 5,282 1,941 – 5.0 6.4 –
US dollar 4,953 (1,487) 3,466 2,608 858 – 7.6 0.9 –
Japanese yen 2,218 2,618 4,836 4,798 31 7 1.6 0.7 1.5
Other 254 (148) 106 106 –––––
Gross financial liabilities 14,205 80 14,285 11,448 2,830 7 5.7 4.7 1.5
At 31 March 2003:
Sterling 954 (255) 699 249 450 – 5.9 29.7 –
Euro 4,331 3,020 7,351 7,351 –––––
US dollar 6,115 (4,952) 1,163 997 166 – 4.3 1.6 –
Japanese yen 2,745 2,320 5,065 4,368 678 19 2.5 1.1 4.9
Other 405 (59) 346 346 –––––
Gross financial liabilities 14,550 74 14,624 13,311 1,294 19 3.9 11.1 4.9
Interest on floating rate borrowings is based on national LIBOR equivalents or government bond rates in the relevant currencies.
The figures shown in the tables above take into account interest rate swaps used to manage the interest rate profile of financial liabilities.
Further protection from euro and Japanese yen interest rate movements on debt is provided by forward starting interest rate swaps (“IRS”). The Group has
entered into euro denominated forward starting IRS and interest rate futures which cover the period June 2005 to June 2007 for an amount equal to
£1,471 million (2003: £nil). The effective rate which has been fixed is equal to 3.35% per annum. The Group has entered into Japanese yen denominated
forward starting IRS and interest rate futures which cover the period June 2005 to September 2005, September 2005 to December 2005, December 2005 to
March 2006 and March 2006 to March 2007 for amounts equal to £3,256 million (2003: £1,067 million), £3,635 million (2003: £1,067 million), £1,046 million
(2003: £1,067 million) and £3,975 million (2003: £4,005 million), respectively. The effective rates which have been fixed range from 0.329% per annum to
0.364% per annum.
19. Financial liabilities and assets continued