Time Warner Cable 2014 Annual Report Download - page 93
Download and view the complete annual report
Please find page 93 of the 2014 Time Warner Cable annual report below. You can navigate through the pages in the report by either clicking on the pages listed below, or by using the keyword search tool below to find specific information within the annual report.-
 1
1 -
2
-
3
-
4
-
5
-
6
-
7
-
8
-
9
-
10
-
11
-
12
-
13
-
14
-
15
-
16
-
17
-
18
-
19
-
20
-
21
-
22
-
23
-
24
-
25
-
26
-
27
-
28
-
29
-
30
-
31
-
32
-
33
-
34
-
35
-
36
-
37
-
38
-
39
-
40
-
41
-
42
-
43
-
44
-
45
-
46
-
47
-
48
-
49
-
50
-
51
-
52
-
53
-
54
-
55
-
56
-
57
-
58
-
59
-
60
-
61
-
62
-
63
-
64
-
65
-
66
-
67
-
68
-
69
-
70
-
71
-
72
-
73
-
74
-
75
-
76
-
77
-
78
-
79
-
80
-
81
-
82
-
 83
83 -
 84
84 -
 85
85 -
 86
86 -
 87
87 -
 88
88 -
 89
89 -
 90
90 -
 91
91 -
 92
92 -
 93
93 -
 94
94 -
 95
95 -
 96
96 -
 97
97 -
 98
98 -
 99
99 -
 100
100 -
 101
101 -
 102
102 -
 103
103 -
104
-
105
-
106
-
107
-
108
-
109
-
110
-
111
-
112
-
113
-
114
-
115
-
116
-
117
-
118
-
119
-
120
-
121
-
122
-
123
-
124
-
125
-
126
-
127
-
128
-
129
-
130
-
131
-
132
-
133
-
134
-
135
-
136
-
137
-
138
-
139
-
140
-
141
-
142
-
143
-
144
-
145
-
146
-
147
-
148
-
149
-
150
 |
 |

TIME WARNER CABLE INC.
NOTES TO CONSOLIDATED FINANCIAL STATEMENTS—(Continued)
Annual Impairment Analysis
In the first quarter of 2014, in connection with the Company’s determination that it has three reportable segments, the
Company performed an evaluation of its reporting units and concluded that the Company has three reporting units
(Residential Services, Business Services and TWC Media). The Company reallocated its goodwill to the new reporting
units based upon the relative fair value of each reporting unit as of January 1, 2014. The Company determined that the fair
value of each of the reporting units was significantly in excess of the respective carrying value.
The estimated fair value of each reporting unit for purposes of re-allocating goodwill was performed using a
combination of a DCF analysis and a market-based approach, which utilized significant unobservable inputs (Level 3)
within the fair value hierarchy. The inputs used in the DCF analysis included forecasted cash flows under the Company’s
most recent long-range projections, discount rates that reflect the risks inherent in each reporting unit and terminal growth
rates. The market-based approach imputed the value of the reporting units after considering trading multiples for other
publicly traded cable companies, telecommunications providers, and advertisers that are similar to the Company’s
reporting units.
In addition, the Company performed a quantitative impairment test of its cable franchise rights resulting in the
conclusion that the fair value of these assets were significantly in excess of their carrying value. The quantitative
impairment test for cable franchise rights was performed using a DCF analysis. The inputs used in the DCF analysis
included forecasted cash flows under the Company’s most recent long-range projections attributable to the cable franchise
rights and discount rates that reflect the risks inherent in the cable franchise rights.
As of the Company’s July 1, 2014 annual testing date and based on its qualitative assessment, the Company
determined that it was not more likely than not that its cable franchise rights and goodwill were impaired and, therefore,
the Company did not perform a quantitative assessment as part of its annual impairment testing. In making that
determination, management identified and analyzed qualitative factors, including factors that would most significantly
impact a DCF analysis of the fair values of the cable franchise rights and the fair values of the Company’s reporting units.
This process included a review of the Company’s most recent projections, analysis of operating results versus the prior
year and budget, changes in market values, changes in discount rates and changes in terminal growth rate assumptions.
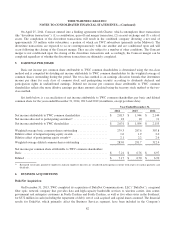
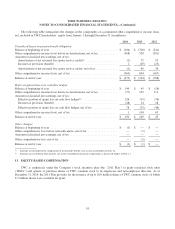
Goodwill by reportable segment as of December 31, 2014 and 2013 consisted of the following (in millions):
December 31,
2014 2013
Residential Services ........................................................... $ 2,259 $ 2,305
Business Services ............................................................. 784 798
Other Operations .............................................................. 94 93
Total goodwill ................................................................ $ 3,137 $ 3,196
85