Time Warner Cable 2014 Annual Report Download - page 58
Download and view the complete annual report
Please find page 58 of the 2014 Time Warner Cable annual report below. You can navigate through the pages in the report by either clicking on the pages listed below, or by using the keyword search tool below to find specific information within the annual report.-
 1
1 -
2
-
3
-
4
-
5
-
6
-
7
-
8
-
9
-
10
-
11
-
12
-
13
-
14
-
15
-
16
-
17
-
18
-
19
-
20
-
21
-
22
-
23
-
24
-
25
-
26
-
27
-
28
-
29
-
30
-
31
-
32
-
33
-
34
-
35
-
36
-
37
-
38
-
39
-
40
-
41
-
42
-
43
-
44
-
45
-
46
-
47
-
 48
48 -
 49
49 -
 50
50 -
 51
51 -
 52
52 -
 53
53 -
 54
54 -
 55
55 -
 56
56 -
 57
57 -
 58
58 -
 59
59 -
 60
60 -
 61
61 -
 62
62 -
 63
63 -
 64
64 -
 65
65 -
 66
66 -
 67
67 -
 68
68 -
69
-
70
-
71
-
72
-
73
-
74
-
75
-
76
-
77
-
78
-
79
-
80
-
81
-
82
-
83
-
84
-
85
-
86
-
87
-
88
-
89
-
90
-
91
-
92
-
93
-
94
-
95
-
96
-
97
-
98
-
99
-
100
-
101
-
102
-
103
-
104
-
105
-
106
-
107
-
108
-
109
-
110
-
111
-
112
-
113
-
114
-
115
-
116
-
117
-
118
-
119
-
120
-
121
-
122
-
123
-
124
-
125
-
126
-
127
-
128
-
129
-
130
-
131
-
132
-
133
-
134
-
135
-
136
-
137
-
138
-
139
-
140
-
141
-
142
-
143
-
144
-
145
-
146
-
147
-
148
-
149
-
150
 |
 |

TIME WARNER CABLE INC.
MANAGEMENT’S DISCUSSION AND ANALYSIS OF RESULTS
OF OPERATIONS AND FINANCIAL CONDITION—(Continued)
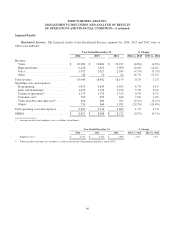
Technical operations. Technical operations costs increased in 2014 primarily due to increased maintenance costs,
higher compensation costs per employee and headcount growth, each of which reflected the Company’s continued
investments to improve the customer experience.
Technical operations costs increased in 2013 primarily due to higher compensation costs per employee.
Customer care. Customer care costs increased in 2014 primarily due to headcount growth and increased call volume,
reflecting the Company’s continued investments to improve the customer experience.
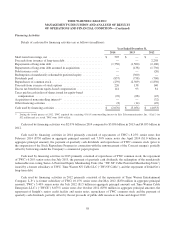
Other operating. Other operating costs decreased in 2014 primarily due to declines in voice costs and bad debt
expense. Voice costs decreased $216 million in 2014, primarily due to a decrease in delivery costs per subscriber as a
result of the in-sourcing of voice transport, switching and interconnection services from Sprint Corporation (which was
completed during the first quarter of 2014).
Other operating costs decreased in 2013 due to declines in a number of categories, including voice costs. Voice costs
decreased primarily due to a decrease in delivery costs per subscriber as a result of the in-sourcing of voice transport,
switching and interconnection services, as well as a decline in voice subscribers.
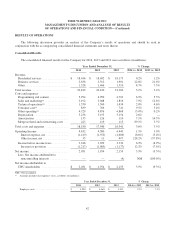
OIBDA. OIBDA decreased in 2014 and 2013 primarily due to higher operating costs and expenses, partially offset
by the increase in revenue, as discussed above.
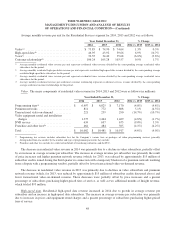
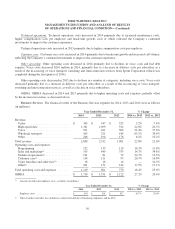
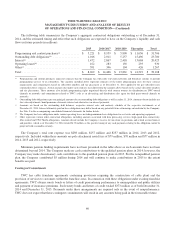
Business Services. The financial results of the Business Services segment for 2014, 2013 and 2012 were as follows
(in millions):
Year Ended December 31, % Change
2014 2013 2012 2014 vs. 2013 2013 vs. 2012
Revenue:
Video .............................. $ 365 $ 347 $ 323 5.2% 7.4%
High-speed data ...................... 1,341 1,099 912 22.0% 20.5%
Voice .............................. 511 421 306 21.4% 37.6%
Wholesale transport ................... 415 251 184 65.3% 36.4%
Other ............................... 206 194 176 6.2% 10.2%
Total revenue .......................... 2,838 2,312 1,901 22.8% 21.6%
Operating costs and expenses:
Programming ........................ 152 133 119 14.3% 11.8%
Sales and marketing(a) ................. 515 449 333 14.7% 34.8%
Technical operations(a) ................. 101 81 72 24.7% 12.5%
Customer care(a) ...................... 134 111 95 20.7% 16.8%
Video franchise and other fees(b) ......... 16 16 14 — 14.3%
Other(a) ............................. 201 171 146 17.5% 17.1%
Total operating costs and expenses ......... 1,119 961 779 16.4% 23.4%
OIBDA ............................... $ 1,719 $ 1,351 $ 1,122 27.2% 20.4%
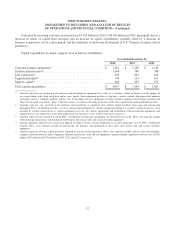
(a) Amounts include total employee costs, as follows (in millions):
Year Ended December 31, % Change
2014 2013 2012 2014 vs. 2013 2013 vs. 2012
Employee costs .............................. $ 643 $ 551 $ 427 16.7% 29.0%
(b) Video franchise and other fees include fees collected on behalf of franchising authorities and the FCC.
50